

Restaurant Financial Visibility Guide | KPI Framework
 Sep 05,2026

Restaurant Financial Visibility Guide
The complete framework for restaurant financial visibility — see every number, control every
decision, and grow with confidence.
Restaurant financial visibility means seeing your key numbers — sales, prime cost, labor cost, food cost, and cash flow — clearly and in real time across every location. It replaces month-end surprises with daily and weekly insight, giving owners the clarity and confidence to act before small problems become expensive.
At KYN | Know Your Numbers, we built this guide for U.S. restaurant owners from the hard lessons of
operating 170+ restaurant locations. If you only review your financial reports once a month, you are already
making decisions with outdated information — successful operators build restaurant financial visibility
instead, because knowing your numbers is what turns hard work into profit. This is the complete guide to the
Financial Visibility System — the framework those operators use to gain financial clarity and make confident
decisions every week

What Is Restaurant Financial Visibility?
Restaurant financial visibility is the ability to monitor, understand, and act on your restaurant’s financial
performance using accurate, up-to-date data. Instead of waiting for month-end statements, you get daily
and weekly insight into:
• Sales — daily, weekly, and by location
• Prime cost — F&B COGS plus total labor
• Food cost and beverage cost
• Labor cost, including taxes and benefits
• Cash flow — cash in, cash out, cash on hand
• Gross profit and net profit
• Inventory and waste
• Location-by-location performance
• Budget vs. actual results
When every important number is visible, decision-making becomes proactive instead of reactive. You stop
discovering problems in the accountant’s report and start catching them on the floor, while they are still
cheap to fix.
Why Does Financial Visibility Matter for Restaurants?
The average U.S. restaurant keeps just 3–6 cents of every sales dollar as profit, so small leaks sink the ship
quickly. Many restaurants generate impressive sales and still lose money — the problem usually isn’t
revenue, it’s why restaurant owners struggle with profitability: a lack of visibility.
Here is what a visibility gap actually costs. Take a restaurant doing $128,650 a week. If prime cost creeps
from 58.7% to 61.7% — three points, the kind of drift that hides inside a monthly P&L — that is $3,860 of
lost margin every week, or roughly $200,700 a year. Caught in week one on a weekly review, it is a
scheduling fix and a vendor call. Caught at month-end, it has already cost more than a manager’s salary.
Without financial clarity, owners discover issues too late: food costs quietly rise, labor scheduling drifts, cash tightens, inventory waste grows, and individual locations underperform for weeks before anyone notices.
Financial visibility solves this by surfacing trends early, while they are still decisions instead of losses.
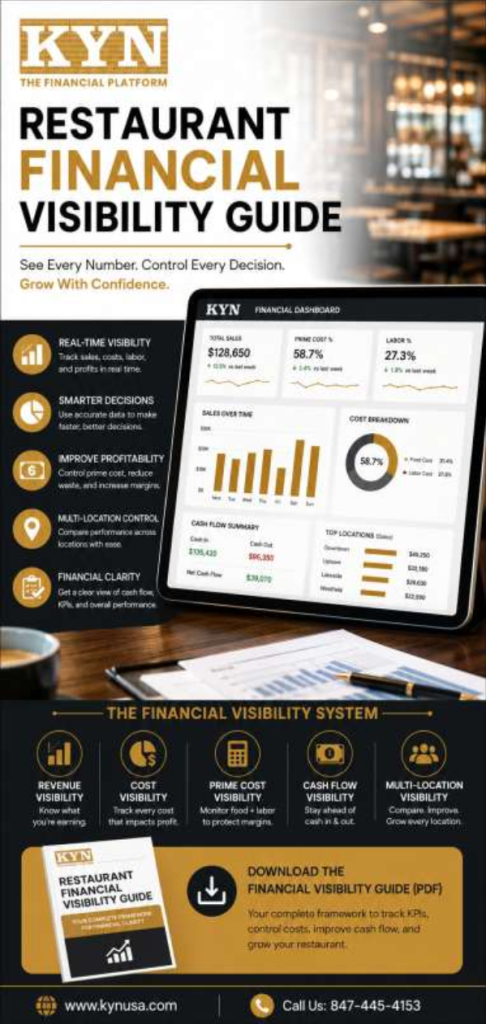
The Financial Visibility System
The Financial Visibility System is KYN’s structured framework that combines financial reporting, operational
KPIs, and weekly decision-making into one process. Instead of reviewing disconnected spreadsheets, every metric works together. The system focuses on five areas.
1. Revenue Visibility
Know what you’re earning — daily sales, weekly sales, monthly revenue, sales by location and category,
average ticket, and guest count. The questions that matter: which locations are growing, which menu
categories perform best, and which day-parts generate the highest revenue? These are the numbers every
business owner should check every week, not every month.
2. Cost Visibility
Costs determine profitability. Track food cost, beverage cost, labor cost, operating expenses, marketing
spend, rent, and utilities — each as a percentage of sales, so a $45,000 week and a $28,000 week are
comparable. Without cost visibility, increasing sales alone rarely improves profit; it just makes the leaks
bigger.
3. Prime Cost Visibility
Prime cost is your food and beverage COGS plus total labor — wages, payroll taxes, and benefits —
expressed as a percentage of sales. It is the largest controllable number in your restaurant, and the
benchmark is clear: at or under 60% of sales. Successful operators monitor it every week, not every month,
because high prime cost usually signals poor scheduling, food waste, excess overtime, or incorrect
purchasing — all fixable within days if you can see them. For the full breakdown, read what is prime cost and why it matters.
4. Cash Flow Visibility
Many restaurants look profitable on paper while struggling to pay bills — profit is an opinion; cash is a fact.
Cash flow visibility answers: how much cash is available today, what bills are due this week, what payroll is
coming, are receivables growing, and are vendors being paid on time? Healthy cash flow is what keeps the
doors open between the P&L’s good months.
5. Multi-Location Visibility
If you operate multiple restaurants, comparison is everything: sales, food cost %, labor %, prime cost, profit
margin, cash position, and inventory variance — side by side, on the same definitions. Standardized
reporting lets you spot the strongest location and lift the weakest one, which is how to compare restaurant performance across locations and how multi-unit businesses keep financial control as they scale. If your
locations still report differently, start with multi-location reporting explained.
Which Financial KPIs Should Every Restaurant Track?
Every restaurant should monitor these metrics consistently — same formula, same source, every week. The benchmark ranges below reflect U.S. industry norms reported by the National Restaurant Association and major restaurant-management platforms.
Sales Growth
Formula: (Current Sales − Previous Sales) ÷ Previous Sales × 100
Compare against last week and the same week last year, not just last month.
Flat sales with rising guest counts means your average check is slipping — look at menu mix before adding
hours.
Food Cost Percentage
Formula: Food Cost ÷ Food Sales × 100
Benchmark: 28–32% of food sales for most full-service and fast-casual concepts.
A single point of food cost on $60,000 of monthly food sales is $600 — track it weekly, because a slow
month-over-month drift of two points quietly erases $14,400 a year.
Labor Cost Percentage
Formula: Total Labor Cost ÷ Total Sales × 100
Benchmark: 25–32% of sales, including wages, payroll taxes, and benefits. Quick-service runs at the low end; full-service runs higher.
Review labor daily against sales, not against the schedule — a slow Tuesday staffed like a busy Friday is
where the percentage breaks.
Prime Cost
Formula: Food & Beverage COGS + Total Labor (wages, taxes, benefits), as % of sales
Benchmark: at or under 60% of sales. Well-run restaurants live between 55% and 60%.
Example: on $100,000 of monthly sales, $30,000 F&B COGS plus $28,000 total labor is a 58% prime cost —
healthy. At $62,000 combined you are losing the margin that pays rent, utilities, and yourself.
Gross Profit
Formula: Sales − Cost of Goods Sold
Benchmark: roughly 65–70% of sales after F&B COGS.
Gross profit funds everything below the line — if it slips under 65%, the problem is purchasing, portioning,
waste, or pricing, and no amount of marketing fixes it.
Net Profit Margin
Formula: Net Profit ÷ Revenue × 100
Benchmark: the average U.S. restaurant nets 3–6% of sales; every point matters.
A restaurant doing $1.5M a year at a 4% margin earns $60,000 — a two-point improvement in prime cost
adds $30,000, a 50% jump in take-home profit.
Cash Flow
Formula: Cash In − Cash Out (weekly)
Track cash on hand, payables due, and payroll coming — profit on paper does not make payroll.
Positive cash flow is what actually funds payroll, vendor payments, equipment replacement, and your next location.
What Should a Restaurant Financial Dashboard Include?
A modern restaurant financial dashboard consolidates every key metric into one easy-to-read interface, so a five-minute glance replaces an hour of spreadsheet work. An effective dashboard includes:
• Revenue metrics — daily, weekly, and monthly sales, plus same-store sales
• Cost metrics — food cost, labor cost, prime cost, and operating expenses
• Profit metrics — gross margin, net margin, and EBITDA
• Cash metrics — cash balance, accounts payable, and accounts receivable
• Operational metrics — guest count, average check, table turns, and inventory usage
When all of these KPIs live in one dashboard, restaurant financial management stops being a monthly
accounting chore and becomes a daily operating habit.
How Do You Run a Weekly Financial Review?
High-performing operators follow a fixed weekly routine — about 20 minutes a day. It works because each day answers one question, and by Friday you have made the five decisions every restaurant owner should make using weekly numbers.
Monday
Review weekend sales. Compare Friday–Sunday against last week and the same weekend last year. Flag any location down more than 5% and find out why before the pattern repeats next weekend.
Tuesday
Analyze labor performance. Pull labor % by day and by location. Match hours against actual sales curves and fix this week’s schedule now — labor saved on Wednesday is worth more than labor explained at month-end.
Wednesday
Review inventory and food cost. Check purchases against sales, look at waste logs, and spot-count your five highest-cost items. A two-point food cost drift caught here is a vendor call; caught in 30 days, it’s a five-figure loss.
Thursday
Monitor cash flow. Confirm cash on hand, bills due in the next 14 days, and the coming payroll. If projected cash dips below one payroll cycle, slow discretionary spending today.
Friday
Compare actuals against budget. Review the week’s sales, prime cost, and profit against plan. Write down the one number you will move next week and who owns it.
Weekly reviews identify problems two to three weeks before month-end statements arrive — and in a
business with 3–6% margins, those weeks are the profit.
What Are the Most Common Financial Visibility Mistakes?
Waiting until month-end
Monthly reporting delays corrective action by up to four weeks. The math from earlier applies: three points
of prime cost drift costs a $128K/week operation nearly $4,000 every week you wait.
Ignoring cash flow
Profitability doesn’t equal cash availability. Restaurants fail with profitable P&Ls because payables, payroll
timing, and debt service drained the account — watch cash weekly, not quarterly.
Tracking too many KPIs
Forty metrics means none get acted on. Focus on the seven that drive decisions — sales, food cost %, labor
%, prime cost, gross profit, net margin, and cash — and review them on a schedule.
Different reports for every location
If one manager reports food cost with beverage included and another without, comparisons are fiction.
Standardize the chart of accounts and definitions across every location.
No weekly review habit
Data without a routine is decoration. Most owners don’t lack numbers — they lack a system, which is exactly
why most small business owners don’t know their numbers. Put the five-day routine above on the calendar
and it fixes itself.
How Do You Build Financial Clarity for a Restaurant?
Achieving financial clarity for restaurants requires more than accounting software — it requires consistent
processes. Build a system that includes:
• Daily sales reporting from your POS
• Weekly KPI reviews on a fixed schedule
• A standard chart of accounts across all locations
• Consistent budgeting and budget-vs-actual tracking
• Prime cost tracking, weekly, against the 60% ceiling
• 13-week cash flow forecasting
• Standardized multi-location reporting
• An executive dashboard the whole leadership team sees
The goal is to eliminate guesswork: every number has one definition, one source, and one owner.
How Does Technology Improve Restaurant Financial Visibility?
Modern restaurant financial management platforms integrate directly with your POS, payroll, accounting
software, inventory systems, and banking data. Instead of manually stitching spreadsheets together every
Sunday night, operators receive automated dashboards with current numbers — which cuts reporting errors, saves 5–10 management hours a week, and means the Monday review runs on Monday, not on the 15th of next month.
How Does Financial Visibility Support Growth?
Expansion multiplies whatever you already have — including your blind spots. That is what changes when you go from 1 location to 10 locations, and it is why growing businesses lose control of their numbers
without a system. Before opening another location, you should be able to answer from your dashboard, not
from memory:
• Which restaurants generate the highest profit, and why?
• Which managers consistently hit their KPIs?
• Which menu items produce the best margins?
• Which expenses keep increasing, and who owns them?
Financial visibility provides these answers before expansion decisions are made — so growth compounds
profit instead of compounding problems
The Role of KYN's Financial Visibility System
KYN | Know Your Numbers is a financial performance platform built by operators, not accountants — the
framework in this guide comes from managing 170+ restaurant locations. The KYN platform replaces delayed reporting with live visibility into sales performance, prime cost, labor trends, cash flow, multi-location comparisons, and weekly KPIs — all on one dashboard. Not accounting. Performance: your books tell you what happened; KYN tells you what’s happening.
FAQs
1 What is restaurant financial visibility?
2 What KPIs should a restaurant monitor?
3 What is a good prime cost for a restaurant?
4 How often should restaurants review financial reports?
5 What is a restaurant financial dashboard?
Get the complete framework
📥 Download the Restaurant Financial Visibility Guide (PDF) — your complete framework to track KPIs,
control prime cost, improve cash flow, and grow your restaurant with confidence.
Get one number that matters in your inbox every week — subscribe to the KYN newsletter.