

Restaurant Financial Reporting in Real Time | KYN
 Oct 09,2026
Restaurant Financial Reporting in Real Time: Why Waiting for Month-End Reports Is Killing Your Margins
Restaurant financial reporting on a daily cadence gives operators time to act — instead of a post-mortem four weeks too late.
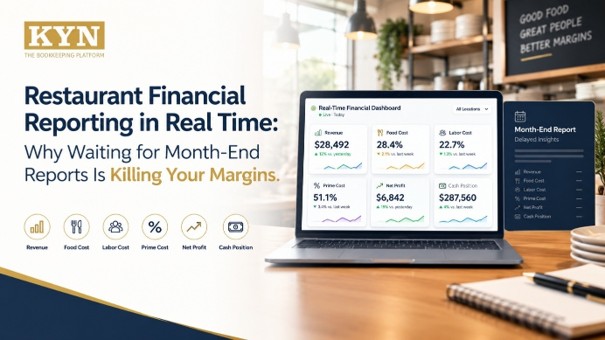
Restaurant financial reporting works best when it happens daily, not monthly. Real-time restaurant reporting shows revenue, food cost, labor cost, and prime cost while there is still time to fix a problem — instead of a month later, when the money is already gone.
What Is Restaurant Financial Reporting in Real Time?
Restaurant financial reporting is the process of tracking a restaurant’s revenue, costs, and profitability. Traditionally that has meant a P&L statement seen weeks after the month it describes. Real-time restaurant reporting is the same discipline on a daily cadence: the same numbers, refreshed daily instead of monthly.
KYN’s version is built from real operating data across 170+ restaurant units, not a theoretical model. The gap between “accurate eventually” and “accurate today” is what this article is about.
Why Do End-of-Month Restaurant Financial Reviews Hurt Margins?
Restaurants operate every day, but many financial decisions still rest on reports reviewed weeks after the activity happened. Sales, labor, and food cost all move today; the full financial picture often doesn’t surface until the month closes.
The problem is not accounting. Accurate accounting is essential for records, taxes, compliance, and long-term planning. The problem is relying on delayed financial information as the main operating decision-making tool. That distinction is the whole idea behind how KYN works: not accounting, performance.
Picture a produce vendor who raises tomato and lettuce prices 9% mid-month. On a monthly report that surfaces as “food cost was high in August” — after 30 days of an unadjusted plate cost. With daily reporting the same increase shows up within a day or two, while there is still a menu cycle left to react.
By the time a month-end review shows food cost climbed or one location lost margin, the window to fix it may already be closed. Delayed data creates delayed decisions, and delayed decisions become expensive ones. The margin for error is thin: in the National Restaurant Association’s 2026 State of the Restaurant Industry report, 42% of operators said their restaurant was not profitable last year, and more than nine in ten named food and labor among their most significant cost challenges. Toast’s industry data puts food costs roughly 34% above pre-pandemic levels. When two in five restaurants are losing money, a cost problem that sits unnoticed for four weeks is not a reporting inconvenience — it is the difference between a profitable quarter and an unprofitable one.
What Changes When Restaurants Move to Real-Time Restaurant Reporting?
Real-time restaurant reporting changes the question from “How did we perform last month?” to “How are we performing right now?” A daily restaurant financial dashboard — like the one behind KYN for Restaurants — puts revenue, net profit, food cost, labor cost, prime cost, cash position, and location performance in front of operators while there is still time to act.
KYN’s Daily Flash Report Matrix is built around exactly this idea: instead of one report at month-end, operators get one view, refreshed daily, that rolls every location’s key numbers into a single screen.
How Does Real-Time Reporting Catch Restaurant Food Cost Problems Earlier?
Restaurant food cost is one of the largest controllable expenses in the business, and small drifts compound fast across thousands of dollars in sales. Rising vendor prices, waste, portion creep, inventory errors, recipe changes, or unexplained variance can all quietly erode margin.
A monthly report can tell an operator that food cost went up. Daily reporting helps them catch it while it is happening — a grilled salmon portion that crept from six ounces to seven over a few weeks shows up as rising plate cost almost immediately, instead of as a mystery three weeks later.
How Can Restaurants Control Labor Costs Before Payroll Becomes a Problem?
Overtime, uneven scheduling, and overstaffing all push restaurant labor cost higher. A restaurant that runs four unplanned extra labor hours across one busy Saturday day-part can see that single shift move the whole week’s labor percentage before anyone notices. Wage pressure leaves less room each year: quick-service hourly wages rose almost 11% between April 2022 and April 2024, from $13.00 to $14.42.
Daily monitoring lets managers ask a sharper question: are labor costs moving faster than sales? If yes, scheduling and overtime can be investigated before the month is finished, not after.
Why Does Prime Cost Matter More Than Food or Labor Cost Alone?
Prime cost combines the two largest controllable expenses in a restaurant, expressed as a share of sales:
Prime Cost = Food & Beverage COGS + Total Labor (wages, taxes, and benefits) |
A restaurant running 30% food cost and 28% labor cost has a 58% restaurant prime cost. Most operators use 60% of sales or lower as the benchmark for a healthy prime cost — above that line there is usually very little room left for rent, utilities, and profit. Watching prime cost daily rather than monthly gives operators an early signal that food, labor, or both need attention. KYN’s Prime Cost Command Center tracks this number against the benchmark automatically, location by location, on the Prime Cost Dashboard.
Does Higher Revenue Always Mean Higher Profit?
Higher sales don’t automatically produce higher profit. A restaurant can grow revenue while food and labor costs climb even faster, quietly shrinking margin even as the top line looks healthy.
Operators need to see the full chain: Revenue → Costs → Margin → Profit → Cash. Real-time restaurant reporting connects those numbers instead of treating sales as the only success metric.
How Do Multi-Location Restaurants Compare Store Performance?
Financial visibility gets harder as a restaurant group grows. Each location carries different sales, labor costs, food costs, managers, vendors, and margins — and a strong top-line number at one store can hide a losing store two miles away.
A centralized restaurant financial dashboard lets operators compare locations side by side, spot outliers, and focus attention where it matters. KYN’s Store Leaderboard™ ranks every location by margin, not just sales, so a five-store group might see something like this on a given week:
| Location | Net Sales | Food Cost % | Labor Cost % | Prime Cost % | Margin % | Status |
|---|---|---|---|---|---|---|
|
Location A |
$124,200 |
29.8% |
27.5% |
57.3% |
12.4% |
On Target |
|
Location B |
$98,750 |
31.2% |
29.1% |
60.3% |
9.8% |
Watch |
|
Location C |
$112,300 |
28.9% |
26.8% |
55.7% |
13.1% |
On Target |
|
Location D |
$87,940 |
33.6% |
31.4% |
65.0% |
6.2% |
Needs Review |
|
Location E |
$103,290 |
30.1% |
28.3% |
58.4% |
11.5% |
On Target |
|
Group Total |
$526,480 |
— |
— |
— |
— |
— |
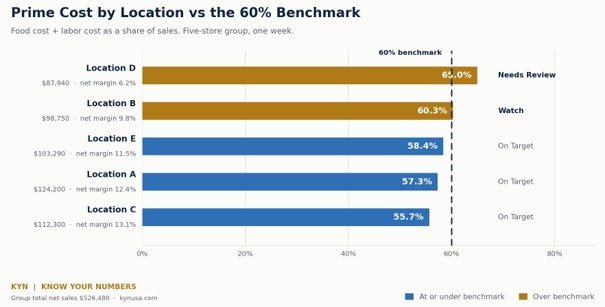
Read by sales alone, Location A looks like the star of the group. Read by margin, Location D is the one bleeding profit at 65% prime cost — five points over benchmark — and it is the store that needs a visit this week, not next month. That is the difference between a list of restaurant KPIs every owner should track and a management tool: one reports the numbers, the other tells you where to look first.
Does Real-Time Reporting Replace Restaurant Accounting?
No. Traditional accounting remains essential for historical records, the general ledger, tax reporting, and compliance. A financial performance layer — see the KYN platform overview — adds daily visibility, cost monitoring, and margin analysis on top of it. It does not replace it.
In simple terms: accounting tells you what happened; real-time restaurant reporting tells you what is happening now. KYN connects to the systems restaurants already run — POS platforms like Toast, Square, and Clover, and accounting software like QuickBooks, Xero, and NetSuite — so the daily view sits alongside existing books rather than replacing them.
What Should Restaurant Owners Monitor Every Day?
A practical daily restaurant financial dashboard should make the most important numbers easy to see at a glance:
- Revenue
- Net Profit
- Food Cost
- Labor Cost
- Prime Cost
- Cash Position
- Location Performance
The value comes from seeing these KPIs together rather than in isolation, so a change in one shows its effect on the others. This is the point where restaurant analytics stops being a spreadsheet exercise and starts being a daily habit — and when the picture gets complicated, KYN’s AI Copilot is built to answer the question every busy operator actually has time to ask: what should I pay attention to today?
What Common Mistakes Do Restaurants Make With Financial Reporting?
Most restaurant financial reporting problems aren’t a lack of data. They’re a handful of habits that let good data go unused:
- Reading the P&L only at month-end. By the time it arrives, the month it describes is over and nothing in it can be changed.
- Tracking food cost without labor cost. A manager who cuts food waste by adding prep staff can still push prime cost higher without noticing.
- Comparing locations on sales instead of margin. The highest-revenue store in a group is sometimes the lowest-margin one.
- Skipping theoretical-versus-actual variance checks. Without comparing what a recipe should cost to what it actually cost, portion creep stays invisible until it has eaten several points of margin.
- Treating cash position and profit as the same thing. A restaurant can be profitable on paper and still run short on cash if timing isn’t tracked daily.
How Does a Better Restaurant Financial Reporting Cycle Work?
The traditional cycle runs: Month Ends → Books Close → Report Arrives → Problem Discovered → Management Reacts. A real-time cycle runs instead: Daily Data → Monitor → Identify Trend → Investigate → Act → Improve.
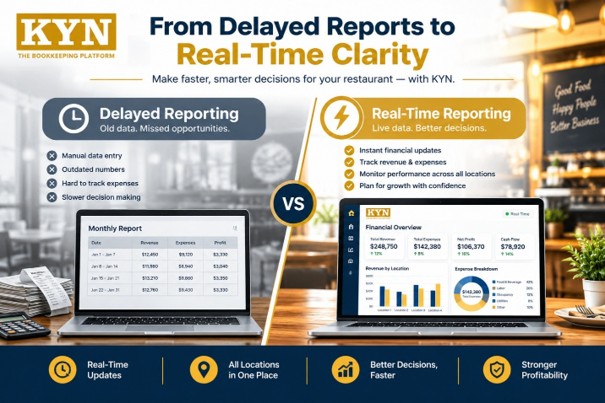
If food cost starts moving the wrong way early in the month, management has time to investigate and correct it. Finding the same issue after the month ends leaves far fewer options — the sales are already booked, the labor is already paid, and the food is already used. This shift, from reading the numbers after the fact to watching them as they happen, is the same idea behind what it means to know your numbers as an operator rather than as an accountant.
FAQs
1 What is real-time restaurant financial reporting?
2 Why is restaurant financial reporting important for daily operations?
3 What should restaurant owners monitor every day?
4 Does real-time financial reporting replace restaurant accounting?
5 What is a good prime cost benchmark for restaurants?
Final Takeaway
End-of-month financial reviews aren’t inherently bad — they’re simply too slow to be the only financial feedback a fast-moving restaurant business gets. Restaurant financial reporting built around a daily cadence helps operators move from asking “Why did our margins fall last month?” to “What is affecting our margins today, and what can we do about it?”
That shift — from historical reporting to active financial performance management — helps operators gain visibility, control costs, and make informed decisions while there is still time to act.
GET A CLEARER VIEW OF YOUR RESTAURANT’S FINANCIAL PERFORMANCE
See your revenue, food cost, labor cost, prime cost, and cash position on one daily screen — across every location, alongside the books you already keep.
Book a Demo · kynusa.com · 847-445-4153
Sources
- National Restaurant Association, 2026 State of the Restaurant Industry — org
- Toast, Restaurant Industry Statistics — toasttab.com
Know Your Numbers. Grow With Confidence. — kynusa.com