


Multi-Location Restaurant Reporting Explained | KYN USA
 Jul 25,2026
In short: Multi-location reporting combines each restaurant’s financials into one consolidated view
while still showing location-level detail. Done right, it uses one chart of accounts and a consistent
cadence, so owners can roll up the whole group, compare locations fairly, and act from a single
source of truth.
Growing from one restaurant to multiple locations is an exciting milestone. It is also the moment multi-
location restaurant reporting becomes make-or-break: you now have to understand your numbers across every location without losing sight of individual performance.
At KYN, we learned this as operators, not consultants — before building the platform, our team ran
restaurant operations spanning 170+ locations. The pattern we saw (and lived) is the same one most
growing restaurant groups hit: juggling multiple profit and loss statements, spreadsheets, and
accounting reports creates confusion rather than clarity. Questions like these become difficult to
answer:
• Which location is the most profitable?
• Which restaurant has the highest labor costs?
• Are food costs consistent across all stores?
• Why is one location underperforming despite similar sales?
• What is the overall profitability of the entire restaurant group?
Instead of viewing each restaurant as a completely separate business, effective reporting gives owners
both a consolidated restaurant P&L and detailed location-level insights. This balanced approach helps
restaurant groups make faster, smarter financial decisions.
In this guide, you’ll learn how multi-location reporting works, why a consistent chart of accounts
matters, and what a clean Consolidated Roll-Up should look like.
What Is Multi-Location Restaurant Reporting?
Multi-location restaurant reporting is the process of combining financial data from every restaurant
location into a single reporting system while preserving the ability to analyze each location individually.
Rather than managing several disconnected reports, owners receive:
• Consolidated financial statements
• Individual location performance
• Group-wide KPIs
• Store-to-store comparisons
• Consistent operational metrics
This creates one reliable source of truth for decision-making. Whether you own two restaurants or fifty,
centralized reporting makes financial management significantly easier.
Why Traditional Reporting Stops Working
Many restaurant groups start by handling each location independently. The accounting team prepares
separate reports for every restaurant, often using different spreadsheets or inconsistent bookkeeping
methods. As the business grows, three problems appear.
Different Account Names
One location records payroll under “Labor Expense.” Another records it as “Employee Costs.” A third
splits payroll into multiple categories. Now comparing labor percentages across the group becomes
almost impossible.
Different Reporting Schedules
Some managers close their books weekly, others monthly, and some reports simply arrive late. Without
consistent reporting periods, comparisons lose accuracy.
Spreadsheet Chaos
Owners often spend hours manually combining reports from multiple locations. Manual consolidation
introduces formula errors, missing transactions, duplicate entries, and outdated reports. The larger the
restaurant group becomes, the greater the risk
Consolidated Reporting vs Location-Level Reporting
Many owners think they must choose between group reporting and individual location reporting. The
reality is that successful restaurant groups use both.
Consolidated Reporting
A consolidated restaurant P&L combines every restaurant into one financial statement. It answers
questions like:
• Is the restaurant group profitable?
• What is total revenue?
• What is total payroll?
• What is total food cost?
• What is overall EBITDA?
This view helps owners understand the health of the entire company.
Location-Level Reporting
Location reporting focuses on each restaurant separately. Managers can evaluate food cost percentage, labor percentage, Prime Cost, sales growth, inventory performance, and guest counts. This allows operators to identify underperforming locations quickly.
Why You Need Both Views
The best reporting systems connect both perspectives. Imagine your restaurant group generated:
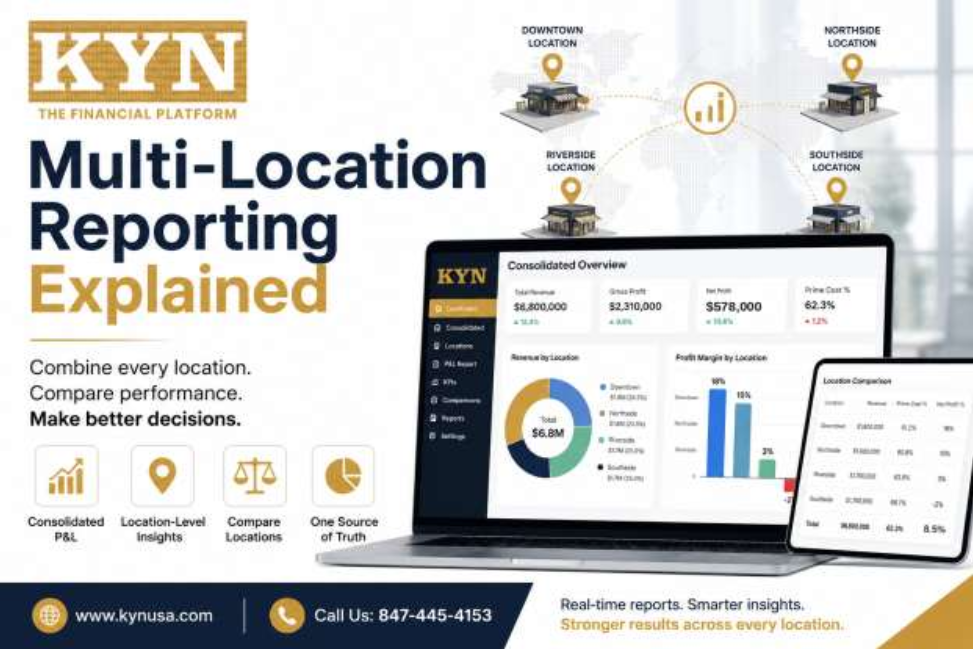
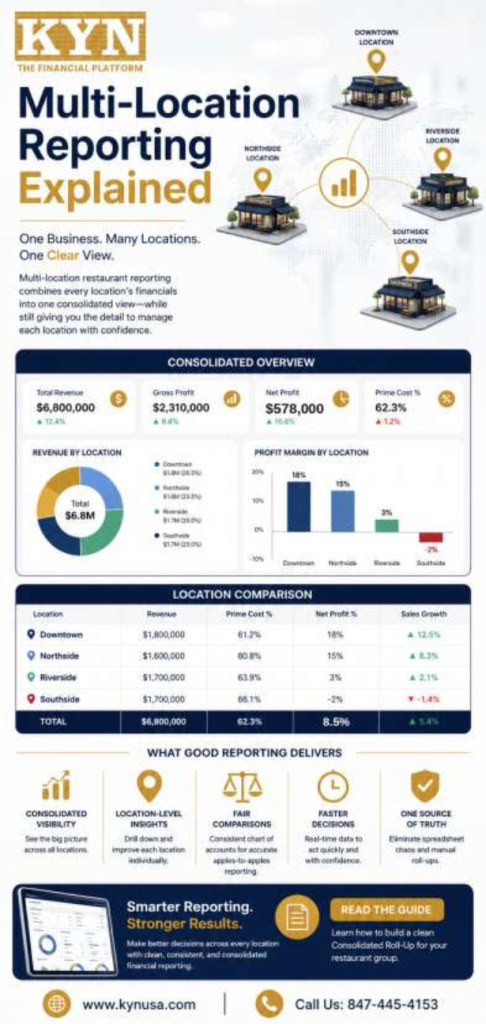
• Total Revenue: $6.8 million
• Net Profit: ≈8.5% (about $578,000)
For a restaurant group, that is a healthy bottom line — the average U.S. restaurant runs closer to a 3–5%
net margin. At first glance, nothing looks urgent. But drilling into the data reveals a different story:
| Location | Revenue | Profit Margin | What It Means |
|---|---|---|---|
|
Store A |
$1,800,000 |
18% |
Top performer — study and
replicate |
|
Store B |
$1,600,000 |
15% |
Healthy and stable |
|
Store C |
$1,700,000 |
3% |
Barely breaking even — investigate
costs |
|
Store D |
$1,700,000 |
−2% |
Losing money — act now |
|
Group Total |
$6,800,000 |
≈8.5% |
Looks healthy — until you drill
down |
Stores A and B are carrying the group. Store C is barely breaking even. And without location-level
reporting, Store D’s losses remain hidden inside the group totals. This is why modern restaurant group
financials always combine consolidated reporting with detailed operational analysis
The Importance of a Consistent Chart of Accounts
One of the biggest reasons multi-location reporting fails is inconsistent accounting structures. Every
restaurant should use the same Chart of Accounts (COA) — revenue accounts match, expense categories
match, payroll accounts match, inventory accounts match, marketing accounts match, and repairs and
maintenance categories match.
When every location records transactions the same way, reports become comparable. Without a
standardized chart of accounts, consolidated reporting becomes unreliable.
How to Standardize Your Chart of Accounts in Four Steps
1. Pick one master COA. Use a restaurant-specific structure: sales by channel, food and beverage
COGS, labor, and operating expenses. Keep it short enough that managers actually use it correctly.
2. Map every location to it. Merge duplicates — “Labor Expense” and “Employee Costs” become one
account. Every legacy account gets a home in the master structure or gets retired.
3. Lock the structure. Location managers should not be able to add new accounts on the fly. Route
change requests through one bookkeeper or controller so the structure stays clean.
4. Set one reporting cadence. A weekly flash report and a monthly close on the same calendar for
every store. Consistent timing is what makes store-to-store comparisons fair.
Once every location posts to the same accounts on the same schedule, consolidation stops being a
monthly project and becomes a report you simply open.
What Is a Clean Consolidated Roll-Up?
The term Consolidated Roll-Up refers to combining financial information from multiple restaurants into
one accurate report while preserving location-level detail. A clean roll-up should include:
Revenue
• Food Sales
• Beverage Sales
• Delivery Sales
• Catering
Cost of Goods Sold
• Food Cost
• Beverage Cost
• Packaging
Labor
• Wages
• Salaries
• Payroll Taxes
• Benefits
Operating Expenses
• Rent
• Utilities
• Marketing
• Repairs
• Insurance
Each category should roll up automatically while still allowing owners to drill down into individual
locations. As a rule of thumb for full-service operations, food cost typically lands around 28–32% of
sales, labor around 25–35%, and combined Prime Cost should stay at or under 60%. This structure
provides both high-level visibility and operational detail.
Key Metrics Every Restaurant Group Should Track
Good reporting across restaurant locations goes beyond basic accounting. Restaurant owners should
monitor:
Sales Growth
Compare current sales with previous periods across every location.
Food Cost Percentage
Identify stores where food waste or purchasing issues are increasing costs.
Labor Cost Percentage
Compare staffing efficiency between restaurants.
Prime Cost
Prime Cost is your food and beverage COGS plus total labor — wages, payroll taxes, and benefits —
expressed as a percentage of sales. It is the single most important profitability metric for restaurant
operators. Keep it at or under 60% of sales. In our example group, Prime Cost sits at 62.3% — exactly
the kind of signal a good roll-up surfaces before it quietly erodes a year of profit.
Average Ticket Size
Understand customer spending patterns by location.
Operating Margin
Measure profitability after operating expenses.
EBITDA
Enterprise restaurant groups often use EBITDA when evaluating long-term financial performance.
Benefits of Multi-Location Restaurant Reporting
Implementing centralized reporting provides several advantages:
• Better decision making. Instead of relying on assumptions, owners use real financial data.
• Faster problem detection. Identify underperforming locations before problems become serious.
• Fair performance comparisons. Every restaurant is measured using identical financial categories.
• Easier budget planning. Historical group reporting improves forecasting accuracy.
• Improved investor reporting. Investors and lenders prefer consistent, consolidated financial
reporting that clearly demonstrates business performance.
• Scalable operations. As new restaurants open, they fit seamlessly into an existing reporting
framework.
Common Reporting Mistakes Restaurant Groups Make
Many operators unknowingly reduce reporting accuracy. Common mistakes include:
• Different charts of accounts at each location
• Manual spreadsheet consolidation
• Delayed monthly reporting
• Inconsistent expense categorization
• Missing operational KPIs
• No standardized reporting cadence
Avoiding these issues creates cleaner financial visibility.
What Great Multi-Location Reporting Looks Like
High-performing restaurant groups usually have dashboards that provide:
• Consolidated restaurant P&L
• Individual location P&Ls
• Side-by-side location comparisons
• Weekly KPI updates
• Prime Cost monitoring
• Labor and food cost trends
• Cash flow visibility
• Budget vs actual performance
• Drill-down reporting for every restaurant
Owners no longer spend hours building reports. Instead, they spend time making informed business
decisions.
How KYN Simplifies Multi-Location Reporting
As restaurant groups expand, financial complexity grows quickly. Managing separate reports,
inconsistent account structures, and manual consolidations can slow decision-making and increase the
risk of errors.
KYN — The Financial Platform is designed to simplify multi-location restaurant reporting by giving
operators a centralized financial view while preserving the detail needed to manage each location
effectively. Not accounting — performance: real-time visibility instead of month-old reports. With KYN,
restaurant groups can:
• View consolidated financial performance across all locations
• Compare individual restaurant performance side by side
• Standardize reporting with a consistent chart of accounts
• Monitor KPIs like Prime Cost, labor, and food cost in one dashboard
• Eliminate manual spreadsheet roll-ups
• Make faster decisions using a single source of financial truth
Whether you’re managing three restaurants or thirty, KYN helps transform scattered reports into
actionable insights that support growth. Know Your Numbers. Grow With Confidence.
Final Thoughts
As restaurant businesses grow, financial reporting must evolve with them. Effective multi-location
restaurant reporting is more than combining numbers — it creates a clear, consistent framework for
understanding both the performance of each restaurant and the health of the entire organization.
By using a standardized chart of accounts, maintaining a consistent reporting cadence, and
implementing a clean Consolidated Roll-Up, restaurant groups gain the visibility needed to improve
profitability, identify operational issues early, and scale with confidence.
The businesses that succeed are not simply collecting more data — they’re using better reporting to
make smarter decisions.
FAQs
1 What is multi-location restaurant reporting?
2 What is a consolidated restaurant P&L?
3 Why is a consistent chart of accounts important?
4 What is a Consolidated Roll-Up?
5 How often should restaurant groups review multi-location reports?
Want to go deeper?
➤ Read the Guide: What Does “Know Your Numbers” Mean?
Get one number that matters in your inbox every week — subscribe to the KYN newsletter.
Call us: 847-445-4153 Visit: www.kynusa.com
By the KYN Operating Team — built by operators who have run 170+ restaurant locations.
Sources
• National Restaurant Association — State of the Restaurant Industry (restaurant.org)
• Toast — Restaurant profit margin and prime cost benchmarks (pos.toasttab.com)