

Restaurant Labor Cost Percentage: Formula & Benchmarks | KYN
 Oct 17,2026
Restaurant Labor Cost Ratio: How to Calculate, Benchmark, and Reduce It (2026 Guide)
Quick take: Restaurant labor cost percentage is total labor cost divided by total sales. NRA data puts 2024 medians at 36.5% for full-service and 31.7% for limited-service restaurants, with profitable operators running lower. Calculate it weekly, compare it by location, and act before month-end.
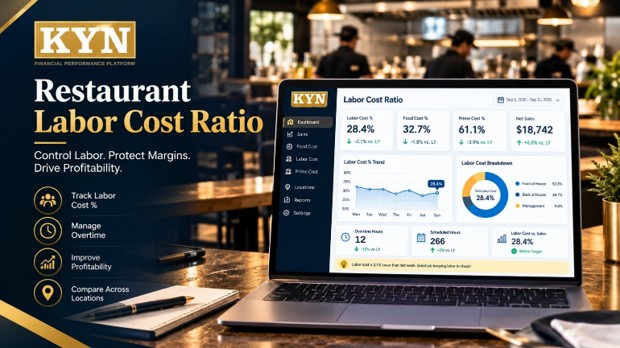
Labor is one of the largest expenses in any restaurant, and your restaurant labor cost percentage shows how much of every sales dollar goes to your team. When a Friday rush runs two servers heavier than it needed to, the labor line moves before anyone sees it on paper.
This guide from KYN covers how to calculate it (also called the restaurant labor cost ratio), what National Restaurant Association data says about benchmarks, and how to bring labor back in line without cutting the shifts that protect service.
What Is Restaurant Labor Cost Percentage?
Restaurant labor cost percentage tells you how much of total sales goes toward paying your team. It is one of the simplest and most important restaurant KPIs because it moves every shift. Unlike rent, labor is a decision you remake each time you build a schedule.
Labor Cost Percentage = Total Labor Cost ÷ Total Sales × 100
Example: $12,000 in total labor cost ÷ $40,000 in total sales × 100 = 30%.
Always match periods: weekly labor with weekly sales, monthly with monthly, and each location’s labor with its own sales.
How Do You Calculate Labor Cost for Your Restaurant?
It takes under a minute once the data sits in one place:
- Add up every dollar of labor for the period: hourly wages, salaried management pay, overtime, and payroll taxes.
- Pull total net sales for the exact same period and location.
- Divide labor by sales and multiply by 100.
The math is simple. The hard part is trusting the inputs, which is why more operators connect POS and payroll data directly.
Download the free Restaurant Labor Cost Calculator
Enter labor and sales by week or location and see labor cost percentage, prime cost, and sales per labor hour in one sheet.
What Is a Good Restaurant Labor Cost Percentage?
There is no single correct number. Concept, check average, and hours all change what healthy looks like. The best public benchmark is the National Restaurant Association’s 2025 Restaurant Operations Data Abstract. In 2024, median labor including benefits was 36.5% of sales for full-service and 31.7% for limited-service, up from roughly 33% and 28% in earlier editions of the report.
| Segment | All respondents (median) | Profitable operators | Operators with a loss | Earlier reports (approx.) |
|---|---|---|---|---|
|
Full-service |
36.5% |
34.2% |
42.9% |
~33% |
|
Limited-service |
31.7% |
30.0% |
34.1% |
~28% |
Labor as a percentage of sales, including salaries, wages, and benefits. Source: National Restaurant Association, 2025 Restaurant Operations Data Abstract (2024 data).
The useful part is the gap. Full-service operators reporting a loss ran labor at 42.9% of sales, more than eight points above profitable ones at 34.2%, according to NRA analysis. The NRA notes the data is a management tool, not a standard. Use it as context, then build your own benchmark from several months of clean data.
What Should Be Included in Labor Cost?
Labor cost can include hourly wages, salaried management pay, overtime, payroll taxes, benefits, bonuses, and paid time off.
Consistency matters more than the mix. Keep the definition identical across periods and locations. The NRA figures above include benefits, so count them the same way when you compare.
Why Does Restaurant Labor Cost Run High?
- Overstaffing during slow periods. Peak staffing carried into a slow Tuesday lunch inflates the percentage unnoticed.
- Poor scheduling. Schedules built from last week’s template instead of demand data put hours in the wrong place.
- Excessive overtime. Recurring overtime on the same shift usually signals a scheduling gap patched with extra hours.
- Low sales per labor hour. If sales are not rising with hours, productivity is falling.
- Location-level outliers. A healthy group average can hide one store running well above target.
Common Mistakes to Avoid
- Mixing time periods. A month of labor against a week of sales hides the real trend.
- Cutting labor to answer a food-cost spike. A vendor price increase hits food cost, not labor. Cutting shifts hurts service and leaves the real issue, pricing or purchasing, untouched.
- Ignoring sales per labor hour. Two locations can show the same percentage while one is far more productive per hour.
- Waiting for month-end. By the time the books close, the costly week is already gone.
How Much Does Employee Turnover Add to Labor Cost?
Labor cost percentage captures payroll, but not the cost of turnover on top. Every departure means recruiting, onboarding, lost productivity while a new hire ramps up, and often overtime to cover the gap. Bureau of Labor Statistics data shows how common departures are: accommodation and food services, the category that includes restaurants, averaged a monthly separations rate of 5.5% across 2025, against 3.3% across all industries, roughly 1.7 times higher.
- Track turnover by location and by role, not just company-wide, since one high-turnover store can inflate costs for the whole group.
- Treat retention as a labor-cost lever, not a separate HR metric. Fewer departures mean fewer training cycles and less overtime.
How Do You Reduce Restaurant Labor Costs Without Hurting Service?
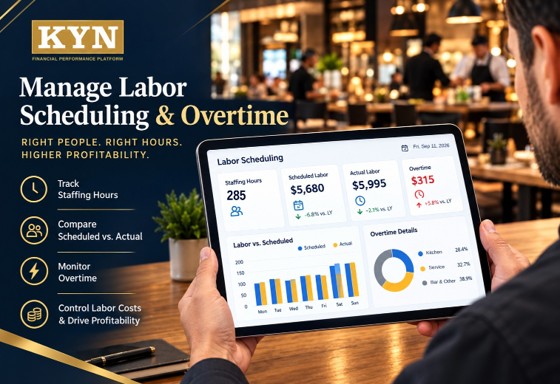
The goal is efficiency, not blindly cutting shifts. Match staffing to demand and give managers information early enough to act.
- Optimize scheduling. Use sales history and forecast demand, not last week’s template.
- Monitor overtime. Track it by employee, role, and location, and investigate repeat overtime instead of just approving it.
- Cross-train. Staff who can move to where demand is highest reduce bottlenecks at peaks.
- Connect your systems. Link your POS, payroll platform (such as ADP, Gusto, Rippling, or Paychex), and accounting data so managers see labor in one place.
- Compare labor to sales daily or weekly, so a bad trend is caught mid-cycle.
- Address turnover directly. Better onboarding, steady schedules, and clear growth paths often pay for themselves.
Which Restaurant KPIs Should You Track With Labor Cost?
Labor needs context. The restaurant KPIs that supply it are prime cost, food cost percentage, sales per labor hour, and overtime. Prime cost combines your two largest controllable expenses:
Prime Cost = Food & Beverage COGS + Total Labor Cost
KYN’s guide to restaurant prime cost puts the typical range at 55–65% of sales, and many operators aim to stay at or under 60%. Adjust to your concept, and watch food and labor together, since a strong food-cost number can mask a labor problem.
How Can You Track Labor Cost Daily Across Every Location?

Traditional accounting records the past. Daily reporting lets operators act while there is still time to adjust the schedule.
KYN’s Daily Flash Report Matrix puts same-day sales, labor %, food cost, and prime cost on one screen. The Prime Cost Command Center shows when food and labor together drift past target before the week is over. The Store Leaderboard™ ranks every location side by side, and the AI Copilot helps surface outliers.
KYN connects to POS systems such as Toast, Square, and Clover, payroll platforms such as ADP, Gusto, Rippling, and Paychex, and accounting systems such as QuickBooks, Xero, and NetSuite, sitting on top of your existing books instead of replacing them. It was built from real operating data managing 170+ units.
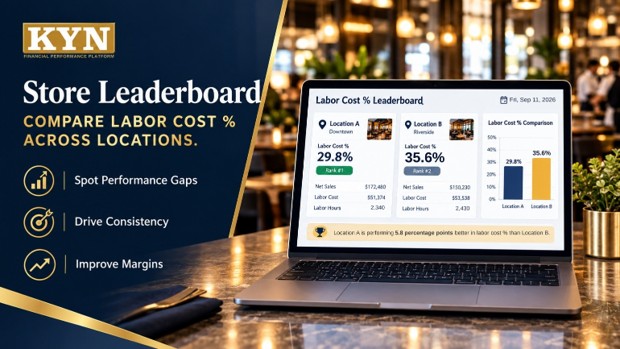
A company-wide labor percentage can hide the one store that needs attention. Compare locations on labor %, sales, hours, sales per labor hour, and overtime, as in our guide to comparing restaurant performance across locations. Our explainer on multi-location restaurant reporting shows how the data rolls up across every location. For the bigger picture, see what “Know Your Numbers” actually means.
A Quick Example: Two Locations, Same Sales
Sales Per Labor Hour = Total Sales ÷ Total Labor Hours
Two locations each generate $30,000 in sales in one week. Assume an average labor cost of $20 per hour, including payroll taxes.
- Location A: 600 labor hours. $30,000 ÷ 600 = $50.00 in sales per labor hour. Labor cost is $12,000, or 40.0% of sales.
- Location B: 450 labor hours. $30,000 ÷ 450 = $66.67 in sales per labor hour. Labor cost is $9,000, or 30.0% of sales.
Revenue is identical, but at the same wage Location A’s labor percentage is one-third higher, and Location B produces $16.67 more sales per hour worked. A side-by-side view like the Store Leaderboard™ surfaces exactly that gap.
Put these numbers to work
Run your own locations through the free calculator, or see KYN update labor and prime cost daily.
FAQs
1 What is a good restaurant labor cost percentage?
2 How do I calculate restaurant labor cost percentage?
3 Can I reduce labor costs without reducing service?
4 Why track labor cost daily or weekly instead of monthly?
5 How does labor cost affect prime cost?
The Bottom Line
Your restaurant labor cost percentage is a signal. Calculate it consistently, benchmark it against your own concept and not just an industry median, and manage it before small increases become margin problems. KYN was built from real operating data managing 170+ units to make that number visible every day, not just at month-end.
Know Your Numbers. Grow With Confidence. — kynusa.com
Sources
- National Restaurant Association — Restaurant labor costs are well above historical averages
- National Restaurant Association — Elevated labor costs had a significant impact on restaurant profitability in 2024
- S. Bureau of Labor Statistics — Job Openings and Labor Turnover, January 2026, Table 20 (2025 annual averages)
- KYN — Restaurant Prime Cost guide