

Restaurant Chart of Accounts: Setup Guide + Template
 Oct 03,2026
How to Set Up a Restaurant Chart of Accounts (The Right Way)
The account structure that makes food cost, labor cost and prime cost readable straight from your books — with a free template you can copy.
A restaurant chart of accounts is the list of accounts a restaurant uses to record every dollar it takes in and spends. Built correctly — food and beverage split in both sales and COGS, all labor grouped — it makes food cost, labor cost and prime cost readable straight from your books.
Most restaurant owners inherit their chart of accounts. It arrives as the default template inside QuickBooks, or from whoever set the books up three years ago, and nobody questions it — until the day you try to work out why food cost moved and the numbers will not tell you. At KYN, working with restaurant operators across 170+ locations, we see the same pattern: the reporting problem is not the reporting software. It is the account structure underneath it.
The stakes are not academic. The National Restaurant Association’s 2026 State of the Restaurant Industry report found that 42% of operators said their restaurant was not profitable, and that more than nine in ten cite food, labor, insurance, energy and swipe fees as significant challenges. You cannot control a cost you cannot see on its own — and what your accounts separate is exactly what you get to see.
This guide covers how to set up restaurant accounting from the account structure up: the categories, the numbering ranges, a step-by-step build, the two rules that make prime cost computable, and the mistakes that ruin otherwise good books. There is a free restaurant chart of accounts template at the end that you can copy directly.
What Is a Restaurant Chart of Accounts?
Your chart of accounts is the master list of every account in your general ledger. Assets, liabilities, equity, revenue and expenses, each with a number and a name. Every food invoice, payroll run and delivery deposit lands in one.
A restaurant chart of accounts is that same list, shaped around how a restaurant earns and spends: food and beverage bought, sold and costed separately; labor split between kitchen and dining room; revenue broken out by channel.
The distinction sounds administrative. It is not. Your chart of accounts decides which questions your financial statements can answer. A generic structure tells you that you spent $184,000 last month. A restaurant structure tells you food ran 32.4%, labor 33.1% and prime cost 65.5% — several points high, and which of the two is responsible.
Why Does a Generic Chart of Accounts Fail a Restaurant?
Default templates serve every business, which means they are optimized for none. Five things go wrong immediately:
- Food and beverage share one bucket. A single “Cost of Goods Sold” line makes food cost percentage and pour cost impossible to calculate — two very different margins averaged into one meaningless number.
- Labor is scattered. Wages in one account, salaries in another, payroll taxes under general overhead. Total labor never subtotals, so neither does prime cost.
- Revenue arrives as one line called “Sales.” Dine-in, takeout, delivery and catering have wildly different economics. Collapsed together, a growing delivery mix looks like growth until the margin disappears.
- Paper, packaging and delivery commissions land in office expenses. They are costs of sale; filed as overhead they understate what it costs to serve a guest.
- Occupancy is mixed into operating expenses. Rent does not flex with sales; food does. Blending them hides the costs a manager can actually move.
Any one is survivable. Together they mean the two numbers that decide whether a restaurant makes money — food cost percentage and prime cost — cannot be read off the P&L.
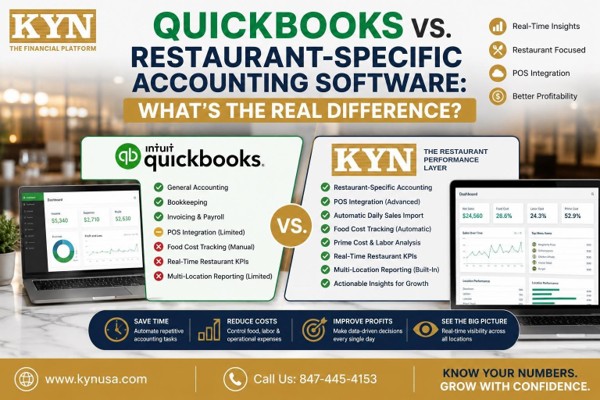
So can you use the QuickBooks chart of accounts for restaurants? Yes — as a starting point. QuickBooks, Xero and NetSuite all let you rebuild the account list. The default is where you start, not where you stop.
What Accounts Should a Restaurant Chart of Accounts Include?
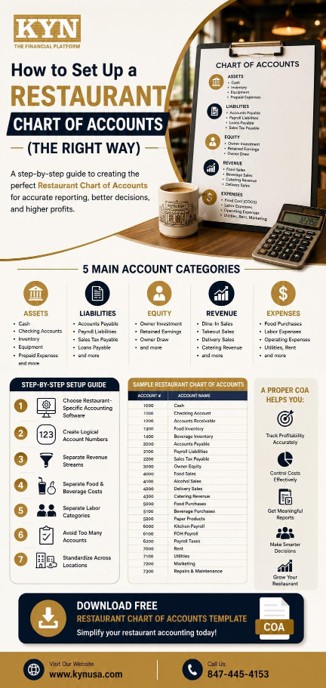
Every chart of accounts has the same five categories. What changes for a restaurant is what goes inside them. The table below is a working restaurant chart of accounts example — the number ranges, the restaurant expense categories that belong in each, and what each one buys you.
| Range | Category | Why it matters in a restaurant | Why it matters in a restaurant |
|---|---|---|---|
|
1000–1999 |
Assets |
Cash · Checking · Savings · Accounts Receivable · Food Inventory · Beverage Inventory · Prepaid Expenses · Kitchen Equipment · Furniture & Fixtures · POS Equipment · Security Deposits |
Food and beverage inventory sit here as separate assets. Their opening and closing balances are what make an accurate COGS figure possible at all. |
|
2000–2999 |
Liabilities |
Accounts Payable · Payroll Liabilities · Sales Tax Payable · Credit Card Payable · Equipment Loans · SBA Loans · Gift Card Liability · Lease Obligations |
Gift cards are a liability until they are redeemed, not revenue on sale. Booking them as sales overstates revenue and hides what you owe your guests. |
|
3000–3999 |
Equity |
Owner Investment · Owner Draw · Retained Earnings · Current Year Earnings |
Keeps owner draws out of operating expenses, where they quietly distort every margin on the P&L. |
|
4000–4999 |
Revenue |
Dine-In Sales · Takeout Sales · Delivery Sales · Catering Revenue · Beer Sales · Wine Sales · Liquor Sales · Merchandise · Gift Card Redemptions · Comps & Discounts (contra) |
Separate channels show which revenue actually carries margin. Delivery at a 30% commission is a different business from dine-in, and should never share a line with it. |
|
5000–5999 |
Cost of goods sold |
Food Purchases · Beverage Purchases (beer, wine, liquor, non-alcoholic) · Paper & Packaging · Kitchen Supplies · Condiments · Inventory Adjustments |
Split food from beverage here and food cost % and pour cost calculate themselves. Lump them together and neither number exists. |
|
6000–6999 |
Labor |
Kitchen Wages · Front-of-House Wages · Management Salaries · Payroll Taxes · Employee Benefits · Overtime · Workers’ Compensation |
One range for every labor dollar means total labor subtotals cleanly — the second half of prime cost. |
|
7000–7999 |
Operating expenses |
Utilities · Marketing · Repairs & Maintenance · Cleaning Supplies · Smallwares · Merchant Processing Fees · Delivery Commissions · Software · Uniforms · Training |
The controllable costs — the accounts a manager can actually move between this week and next. |
|
8000–8999 |
Occupancy |
Rent · Common Area Maintenance · Property Insurance · Property Taxes · Licenses & Permits |
Fixed costs, deliberately separated. Occupancy does not flex with sales, so mixing it into operating expenses hides which costs are controllable. |
|
9000–9999 |
Other / corporate |
Interest Expense · Depreciation & Amortization · Corporate Overhead · Management Fees · Income Taxes |
Below-the-line items. Keeping them out of store-level results is what makes one location comparable to another. |
How Do You Number a Restaurant Chart of Accounts?
The numbering is not decoration. It makes reports sort correctly, subtotals roll up cleanly, and two locations comparable. Three conventions matter:
- Leave gaps. Number in hundreds — 5000, 5100, 5200 — so you can insert an account later without renumbering. Renumbering a live chart breaks every historical comparison you have.
- Use sub-accounts for detail. 5100 Beverage Purchases with 5110 Beer, 5120 Wine and 5130 Liquor beneath gives you the detail and the rolled-up total. Four top-level accounts give you only the detail.
- Use identical numbers at every location. Store 4’s food purchases must be account 5000, same as Store 1’s. The moment numbering drifts, consolidation becomes a manual mapping exercise every month.
How Do You Set Up a Restaurant Chart of Accounts, Step by Step?
Step 1. Start from the industry standard, not a blank page
The National Restaurant Association publishes the Uniform System of Accounts for Restaurants (USAR), now in its 8th edition — the standardized framework for restaurant account structure. Starting there means your P&L reads the way lenders, franchisors and restaurant CPAs expect, and that industry benchmarks apply. Build from it, then customize to your concept.
Step 2. Map your POS sales categories to revenue accounts first
Work backwards from what your POS already tracks. If Toast or Square separates dine-in, takeout, delivery and catering, your 4000s should mirror those categories exactly, so the daily sales import posts cleanly.
Step 3. Split food and beverage everywhere
In sales and in COGS. Food Sales and Beverage Sales in the 4000s; Food Purchases and Beverage Purchases in the 5000s. This one decision makes food cost percentage and pour cost calculable.
Step 4. Group every labor dollar into one range
Kitchen wages, front-of-house wages, salaries, payroll taxes, benefits and overtime all belong in the 6000s. Split kitchen from front-of-house within the range so you can see which side is drifting, but keep both under one heading so total labor subtotals on its own.
Step 5. Separate occupancy from operating expenses
Put rent, CAM, property insurance, property taxes and permits in the 8000s, apart from the controllable costs in the 7000s. A manager reading the P&L then sees which costs they can influence and which are fixed.
Step 6. Keep it lean
The instinct at setup is an account for everything. Resist it. The test: if a line will not change a decision you make, it is a sub-account, not an account. You do not need accounts for napkins, straws and to-go containers — you need Paper & Packaging.
Step 7. Standardize across locations, then review it with your CPA
Every location uses the identical chart of accounts — same numbers, same names. That is what makes consolidated reporting possible without a spreadsheet in the middle. Then walk it through with your CPA before posting a single transaction; twenty minutes at setup saves a reclassification project at year end. If you run several sites, our guide to multi-location restaurant reporting covers what changes once it has to serve more than one P&L.
Which Two Rules Make a Restaurant Chart of Accounts Actually Work?
Strip it back to its purpose and you get one number: prime cost. Prime cost is food and beverage COGS plus total labor, as a percentage of sales. Most healthy restaurants run between 55% and 65%, and at or under 60% is the number to aim for. Whether you can see it at all is decided by your chart of accounts.
Rule one: split food and beverage in both the 4000s and the 5000s. Without it, food cost percentage does not exist — you have a blended figure that moves with your drink mix.
Rule two: every labor dollar lives in the 6000s. Leave payroll taxes under general overhead and labor is understated by three or four points, so prime cost is wrong in the direction that feels comfortable.
Get those two right and prime cost falls out of your P&L every period. Miss either and it stays a manual assembly job. That is what we mean by knowing your numbers — the structure has to make the number visible before anyone can act on it.
Where Does KYN Fit?
A well-built chart of accounts organizes the past accurately. It still does not tell you how today went.
To be clear about what goes where: KYN is not accounting software, and you do not build your chart of accounts in KYN. It lives in QuickBooks, Xero or NetSuite, set up with your CPA. KYN is the performance layer on top of the books you already keep — it reads the structure you just built and turns it into something you can act on this week rather than next month. Not accounting. Performance.
Once your accounts are shaped correctly, that means:
- A Prime Cost Command Center tracking food, beverage and total labor against the 60% benchmark as the period runs, not after it closes.
- A Daily Flash Report with net sales, prime cost and cash position, by location, every morning.
- A Store Leaderboard ranking every location on the metrics you choose, so the outlier finds you.
- Menu engineering and item-level profitability, showing which dishes carry the margin.
- An AI Copilot you can ask, in plain language, why food cost moved.
It connects to Toast, Square, Clover, Revel, NCR and Micros on the POS side; QuickBooks, Xero and NetSuite on the accounting side; and ADP, Gusto, Rippling and Paychex for payroll. For the specific figures to hold any of it against, start with the restaurant KPIs every owner should track. KYN was built from real operating data across 170+ restaurant units. No configuration fees.
What Are the Most Common Restaurant Chart of Accounts Mistakes?
- Copying a retail or generic template and stopping there
The default is a starting skeleton, not a finished structure. Left untouched it produces books that are correct and useless — accurate totals, no answers.
- Lumping food and beverage together
The most expensive mistake here. A bar at 22% pour cost and a kitchen at 34% food cost average to a number that describes neither, and hides whichever one is drifting.
- Scattering labor across the P&L
Wages in the 6000s, payroll taxes in the 7000s, benefits under administrative. Nothing is misfiled, and total labor still never appears — so prime cost gets assembled by hand.
- Building 400 accounts you will never read
Detail feels like control. Past a point it is the opposite: staff guess which of six similar accounts an invoice belongs to, and month-to-month comparisons stop meaning anything.
- Treating the chart of accounts as set-and-forget
You added delivery, a second location, a catering arm — and the structure never moved. Review it yearly: archive what is dead, add what is material, never renumber what is live.
FAQs
1 What is a restaurant chart of accounts?
2 Can I use the default QuickBooks chart of accounts for a restaurant?
3 How many accounts should a restaurant chart of accounts have?
4 Should food and beverage purchases be separate accounts?
5 Who should set up a restaurant's chart of accounts?
Build It Once, Read It Every Day
Your chart of accounts is not an accounting formality. It is the decision, made once, about what your business will be able to see about itself. Get it right — food and beverage split, labor grouped, occupancy separated, lean enough that a manager will read it — and prime cost, food cost and labor cost stop being spreadsheet projects.
The only question left is how often you look. A correct structure read once a month is worth far less than the same structure read weekly — our guide to the decisions worth making from weekly numbers covers what to do with it. That gap — between books that are accurate and numbers that are useful — is where most restaurant profit is won or lost.
Get the free Restaurant Chart of Accounts template
A one-tab spreadsheet with the full structure from this guide — all nine number ranges, restaurant-specific account names, and sub-accounts already mapped for food, beverage and labor. Copy it straight into QuickBooks, Xero or NetSuite.
Download the Restaurant Chart of Accounts template → or see it read daily with a free KYN trial →
Know Your Numbers. Grow With Confidence. — kynusa.com · 847-445-4153
Sources
National Restaurant Association, 2026 State of the Restaurant Industry — 42% of operators reported their restaurant was not profitable; more than 9 in 10 operators cite food, labor, insurance, energy and swipe fees as significant challenges.
restaurant.org/research-and-media/research/research-reports/state-of-the-industry/
National Restaurant Association, The Uniform System of Accounts for Restaurants (USAR), 8th edition — the industry-standard framework for restaurant account structure, financial controls and record keeping.
shop.restaurant.org/The-Uniform-System-of-Accounts-for-Restaurants-Print
KYN internal operating benchmarks, drawn from financial data across 170+ restaurant locations — prime cost healthy range 55–65% of sales, target at or below 60%; typical single-location chart of accounts of 80–150 accounts.