


Why Growing Businesses Lose Control of Their Numbers
 Jul 18,2026

Quick Answer
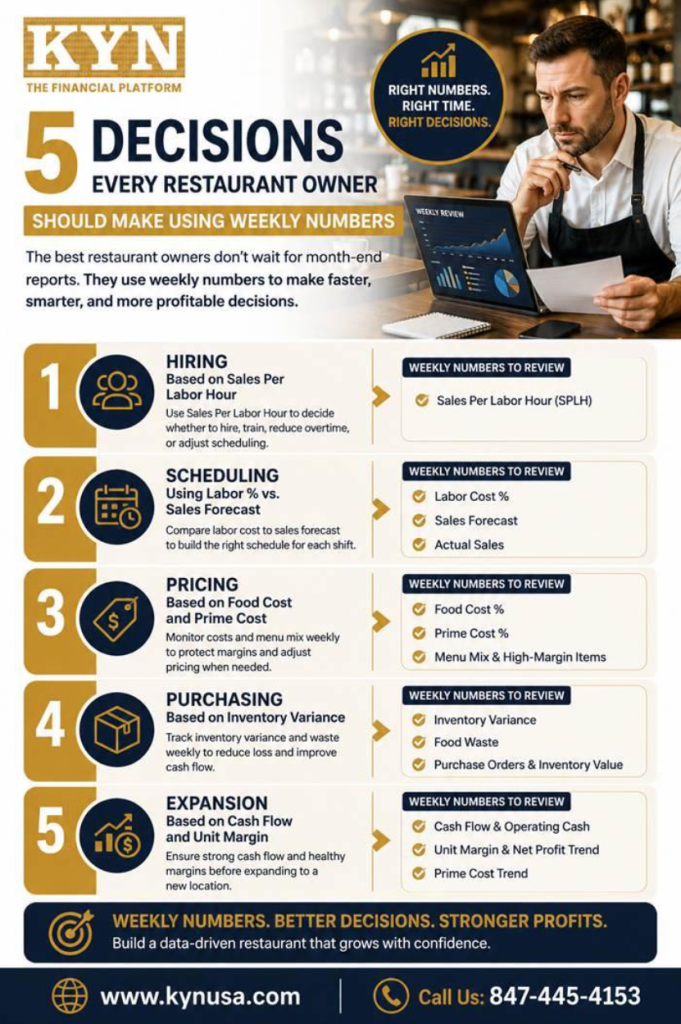
The five decisions every restaurant owner should make from weekly numbers are:
hiring (sales per labor hour), scheduling (labor % vs. forecast), pricing (food cost
and prime cost), purchasing (inventory variance), and expansion (cash flow and unit
margin). Reviewing these five numbers every week turns data into action while there
is still time to adjust.
Running a successful restaurant isn’t about collecting more reports – it’s about making
better decisions at the right time. Many restaurant owners review financial reports once a
month, only to realize they’ve already lost money they can’t recover: by the time monthly
reports arrive, labor has been overspent, food costs have climbed, inventory has
disappeared, and cash flow problems have already developed.
The best operators don’t wait until month-end. They make restaurant decisions based on
weekly numbers.
Weekly reporting creates a rhythm of continuous improvement. Instead of reacting to
problems after they’ve grown, you identify trends early and make small adjustments
before they become expensive mistakes. That is exactly what “Right Numbers. Right
Time. Right Decisions.” means.
Let’s explore the five most important decisions every restaurant owner should make
using weekly numbers — and the key metric behind each one.

Why Weekly Numbers Matter More Than Monthly Reports
Monthly financial statements are essential for accounting, taxes, and long-term planning
– but restaurants operate in real time. Labor changes daily, food prices fluctuate week to
week, customer demand shifts constantly, and inventory never stops moving. If you’re
only reviewing numbers once every 30 days, you’re managing yesterday’s business
instead of today’s.
Using numbers to run a restaurant starts with one simple habit: a consistent weekly restaurant review. Done well, it allows you to:
• Detect issues before profits disappear
• Improve operational consistency
• Make data-driven restaurant decisions
• Keep managers accountable
• Build healthier cash flow
The goal isn’t more reporting. The goal is faster, smarter decisions.
1. Hiring - Based on Sales Per Labor Hour
Hiring more staff isn’t always the answer. Sometimes your current team simply isn’t
scheduled effectively. Before posting another job listing, review one number first.
Weekly number: Sales Per Labor Hour (SPLH)
SPLH shows how much revenue each labor hour generates. For example: weekly sales of
$48,000 ÷ 1,200 labor hours = $40 per labor hour. As a reference point, many full-service
restaurants target roughly $35–$50 SPLH, and quick-service concepts often run higher –
but your own trend line matters more than any industry average.
Compare this week with previous weeks and ask:
• Is SPLH improving or declining?
• Are we overstaffed?
• Are we understaffed during busy periods?
Using this weekly number helps you decide whether to hire new employees, cross-train existing staff, reduce overtime, or simply improve scheduling. Instead of hiring based on
instinct, hire based on performance.
2. Scheduling - Using Labor % vs. Sales Forecast
Labor is usually the largest controllable restaurant expense, and poor scheduling
reduces profitability fast.
Weekly numbers: Labor Cost %, Sales Forecast, Actual Sales
Each week, compare what you scheduled against what actually happened. As a
benchmark, full-service restaurants typically aim to keep labor between 30–35% of sales,
and quick-service concepts between 25–30%. If sales came in lower than forecast but labor stayed high, you’ve overscheduled. If sales exceeded expectations and service slowed down, you were probably understaffed.
A weekly review helps managers answer:
• Should Friday evenings have more servers?
• Are weekday lunch shifts overstaffed?
• Are overtime hours increasing?
• Which shifts consistently perform best?
This is one of the most valuable data-driven restaurant decisions because labor can be
adjusted immediately instead of waiting for next month’s P&L.
3. Pricing - Based on Food Cost and Prime Cost
Many restaurants adjust menu pricing once a year. Meanwhile, supplier costs may
increase every month.
Weekly numbers: Food Cost %, Prime Cost %, Menu Mix, High-Margin Items
As a benchmark, a healthy food cost usually falls between 28–35% of sales, and most
profitable operators work to keep prime cost – food plus labor combined – at or below
about 60%. If food cost keeps rising while menu prices remain unchanged, profitability
shrinks with every plate sold.
Weekly monitoring allows you to:
• Adjust menu pricing sooner
• Promote high-margin dishes
• Remove underperforming items
• Negotiate with suppliers
• Improve recipe consistency
Remember: revenue doesn’t equal profit. Prime cost tells you whether your restaurant is
actually making money – and small pricing adjustments made early often prevent major
profitability issues later.
4. Purchasing - Based on Inventory Variance
Inventory tells a story. If purchases increase while sales remain stable, something is
wrong.
Weekly numbers: Inventory Variance, Food Waste, Purchase Orders, Inventory Value
Inventory variance is the gap between what you should have used (theoretical usage
based on sales) and what you actually used. Top operators work to keep that gap within
about 1–2 percentage points of food cost. Unexpected variance often indicates
over-ordering, waste, portion inconsistency, theft, or vendor issues.
Instead of discovering these problems during month-end inventory counts, weekly
reviews allow immediate action. Questions every owner should ask include:
• Why did inventory increase?
• Which ingredients are moving slowly?
• Which products are frequently wasted?
• Are purchasing patterns matching sales?
Better purchasing decisions improve both cash flow and profitability.
5. Expansion - Based on Cash Flow and Unit Margin
Growth is exciting. But opening another location before your current restaurant is
financially healthy creates unnecessary risk — and expansion decisions should never
rely on sales alone.
Weekly numbers: Cash Flow, Operating Cash, Unit Margin, Net Profit Trend, Prime Cost
Trend Before expanding, many operators look for consistent unit-level margins of 15% or better
and enough operating cash to cover at least three months of expenses. Review these
numbers weekly and ask yourself:
• Is the current location consistently profitable?
• Is cash flow positive every week?
• Can operations run without constant owner involvement?
• Are margins improving?
If these numbers aren’t stable, expansion may only multiply existing problems. Strong
weekly financial discipline creates sustainable growth
Build a Weekly Decision Framework
The most successful operators follow the same review process every week. Here’s a
simple Weekly Decision Framework:
| Decision | Weekly Number | Act When… |
|---|---|---|
|
1. Hiring |
Sales Per Labor Hour
(SPLH) |
SPLH declines for two or more
weeks in a row |
|
2. Scheduling |
Labor % vs. Sales
Forecast |
Labor % runs above your target
for the shift or week |
|
3. Pricing |
Food Cost % & Prime Cost
% |
Prime cost trends above ~60% of
sales |
|
4. Purchasing |
Inventory Variance |
Actual vs. theoretical usage gaps
exceed 1–2 points |
|
5. Expansion |
Cash Flow & Unit Margin |
Only when both are consistently
strong, week after week |
This framework transforms reports into operational action. Numbers only matter when
they change decisions.
How KYN Helps Restaurant Owners Make Better Decisions
Many restaurant owners spend hours gathering information from multiple systems –
sales reports, payroll, inventory, accounting software, and POS systems.
By the time everything is combined, the week is already over.
KYN simplifies the entire process by bringing your key performance numbers together in
one place. Instead of searching for reports, restaurant owners receive the information
they need to make timely decisions. That means you can:
• Monitor labor performance weekly
• Track food and prime cost trends
• Review inventory performance
• Watch cash flow improve
• Make faster, more confident operational decisions
That’s the power of Right Numbers. Right Time. Right Decisions.
FAQs
1 Why are weekly numbers more useful than monthly reports?
2 What are the most important weekly restaurant metrics?
3 How do weekly restaurant reviews improve profitability?
4 What are data-driven restaurant decisions?
5 What does using numbers to run a restaurant mean?
6 How can KYN help restaurant owners?
Final Thoughts
Restaurants generate thousands of data points every week. But success doesn’t come
from having more numbers – it comes from acting on the right ones.
Making restaurant decisions based on weekly numbers helps owners stay proactive
instead of reactive. Whether you’re deciding to hire, adjust schedules, update menu
pricing, tighten purchasing, or plan expansion, weekly reviews provide the clarity needed
to make smarter business decisions. Small improvements made every week compound
into stronger profits, healthier cash flow, and more confident leadership.
Don’t wait for month-end reports to tell you what already happened. Use weekly numbers
to shape what happens next – that’s what using numbers to run a restaurant looks like in
practice.
See How KYN Automates These 5 Critical Restaurant Decisions
Book a demo at kynusa.com and see your weekly numbers come together in one
place -automatically.
Bonus: Download the free Weekly Numbers Checklist (below) and run your first
15-minute weekly review this week.
Bonus: The Weekly Numbers Checklist
Your 15-minute weekly review. Print it, share it with your managers, or let KYN track
every one of these numbers automatically.
| ✓ | Weekly Number | What to check |
|---|---|---|
|
☐ |
Sales Per Labor Hour (SPLH) |
Compare to the last 4 weeks – improving or
declining? |
|
☐ |
Labor Cost % vs. sales
forecast |
Flag any shifts that ran above your labor
target |
|
☐ |
Food Cost % and Prime Cost
% |
Flag the week if prime cost is above ~60% of
sales |
|
☐ |
Menu mix |
Identify your top 5 high-margin items and
bottom 5 performers |
|
☐ |
Inventory variance |
Investigate any actual-vs-theoretical gap
over 1–2 points |
|
☐ |
Food waste log |
Note the top 3 wasted items and the likely
cause |
|
☐ |
Purchase orders vs. sales
trend |
Confirm purchasing is tracking with sales,
not ahead of it |
|
☐ |
Weekly cash flow |
Confirm operating cash flow is positive |
|
☐ |
Unit margin & net profit trend |
Trending up, flat, or down over the last 4
weeks? |
|
☐ |
One decision made this week |
Write down the single action this week’s
numbers triggered |
One rule: never end a weekly review without making at least one decision. Numbers only
matter when they change what you do next.