

How To Compare Restaurant Performance Across Locations | KYN
 Aug 14,2026
How To Compare Restaurant Performance Across Locations
Growing from one restaurant to multiple locations is exciting—but it also introduces a new challenge:
how do you compare restaurant performance across locations fairly?
It has never mattered more. The National Restaurant Association projects industry sales to reach $1.55
trillion in 2026, yet 42% of operators reported their restaurant was not profitable in the prior year. In
an industry this competitive, every location has to pull its weight—and you can’t fix what you can’t
measure fairly.
Many restaurant owners make the mistake of comparing stores using only total revenue. While revenue
is important, it doesn’t tell the whole story. A large flagship location naturally generates more sales than
a smaller neighborhood restaurant, but that doesn’t necessarily mean it’s performing better.
To compare restaurant performance across locations accurately, you need to normalize your data.
Metrics like per-seat sales, sales per labor hour, and same-store sales comparison provide a much
clearer picture of operational efficiency and profitability.
In this guide, you’ll learn how to benchmark every location fairly, calculate a Location Benchmark Score,
and make smarter expansion decisions.

Why Raw Revenue Creates Misleading Comparisons
Imagine you operate two restaurants.
| Location | Monthly Revenue | Seats |
|---|---|---|
|
Downtown |
$420,000 |
180 |
|
Midtown |
$310,000 |
90 |
At first glance, Downtown appears to be the better performer. But after normalizing the numbers:
| Location | Revenue Per Seat |
|---|---|
|
Downtown |
$2,333 |
|
Midtown |
$3,444 |
Now the story changes.
Midtown generates significantly more revenue for every available seat, making it operationally more
efficient. This is why successful multi-location operators avoid judging restaurants solely by total sales.
What Is Restaurant Location Benchmarking?
Restaurant location benchmarking is the process of evaluating each restaurant using standardized
performance metrics instead of raw totals.
Benchmarking removes differences caused by:
• Restaurant size
• Seating capacity
• Operating hours
• Staffing levels
• Customer traffic
• Store maturity
Instead of asking: “Which location made the most money?”
You ask: “Which location performs best relative to its available resources?”
This creates fair comparisons and better management decisions.
1. Compare Sales Per Seat
One of the easiest ways to compare restaurant performance across locations is by measuring sales per
seat.
Formula
Sales Per Seat = Total Sales ÷ Number of Seats
| Location | Sales | Seats | Sales Per Seat |
|---|---|---|---|
|
Store A |
$240,000 |
120 |
$2,000 |
|
Store B |
$180,000 |
60 |
$3,000 |
Although Store A generates more total revenue, Store B uses its seating capacity much more effectively.
Sales per seat is especially useful for casual dining, full-service restaurants, cafés, fine dining, and franchise operations.
2. Measure Sales Per Labor Hour
Labor is one of the largest operating expenses in restaurants. Instead of comparing labor costs alone,
benchmark productivity.
Formula
Sales Per Labor Hour = Total Sales ÷ Total Labor Hours
| Location | Sales | Seats | Sales Per Seat |
|---|---|---|---|
|
Store A |
$210,000 |
4,000 |
$52.50 |
|
Store B |
$210,000 |
3,300 |
$63.64 |
Both stores generate identical revenue. However, Store B produces much more revenue for every labor
hour worked.
This metric highlights scheduling efficiency, staff productivity, and management effectiveness—a critical
edge at a time when more than 9 in 10 operators cite labor costs as a significant business challenge
(National Restaurant Association, 2026).
3. Use Same-Store Sales Comparison
Another essential metric is same-store sales comparison. This compares a restaurant’s performance
against its own previous period instead of comparing different locations.
| Location | Last Year | This Year | Growth |
|---|---|---|---|
|
Store A |
$180,000 |
$198,000 |
+10% |
|
Store B |
$310,000 |
$305,000 |
-1.6% |
Store B still has higher revenue. However, Store A is improving much faster.
Same-store sales remove the effects of new openings, expansion, additional seating, and temporary
promotions. It’s the same reason publicly traded restaurant groups report “comparable sales” to
investors every quarter—it is the cleanest measure of true operational growth.
4. Compare Prime Cost Percentage
High-performing restaurants don’t simply generate revenue—they manage costs effectively.
Prime Cost combines Food Cost + Labor Cost—the two biggest controllable expenses in any restaurant.
Formula
Prime Cost % = (Food Cost + Labor Cost) ÷ Sales × 100
| Location | Prime Cost % |
|---|---|
|
Store A |
54% |
|
Store B |
66% |
Industry benchmark: a healthy prime cost is approximately 60% of food and beverage sales—roughly
55–60% for quick-service restaurants and 60–65% for full-service restaurants (Restaurant365). Store A is
comfortably inside the healthy range; Store B’s 66% signals excessive labor or food waste that is eroding
profitability, even if its revenue looks strong.
Prime Cost is one of the strongest indicators of restaurant financial health.
5. Analyze Guest Count Instead of Revenue
Traffic matters. Two restaurants may produce identical sales while serving very different numbers of
guests.
| Location | Guests | Revenue |
|---|---|---|
|
Store A |
7,500 |
$300,000 |
|
Store B |
5,200 |
$300,000 |
Store B has a higher average guest spend ($57.69 vs. $40.00).
Guest count helps evaluate marketing effectiveness, customer loyalty, menu pricing, and average ticket
size. With 60% of operators reporting softer customer traffic last year (National Restaurant Association,
2026), tracking guests—not just dollars—shows you whether growth is coming from more visits or just
higher prices.
6. Compare Profit Margin
Revenue doesn’t equal profit. Always benchmark gross margin, operating margin, and net profit margin.
| Location | Revenue | Profit | Net Margin |
|---|---|---|---|
|
Store A |
$400,000 |
$48,000 |
12.0% |
|
Store B |
$320,000 |
$60,000 |
18.8% |
Although Store A sells more, Store B earns more money. This is why ranking restaurant locations should
include profitability—not just sales.
Introducing the Location Benchmark Score
Instead of relying on one metric, combine multiple KPIs into a single Location Benchmark Score (LBS)—a
weighted 0–100 rating that ranks every location on a like-for-like basis.
Example scorecard weighting:
| KPI | Weight |
|---|---|
|
Sales Per Seat |
25% |
|
Sales Per Labor Hour |
20% |
|
Same-Store Sales Growth |
20% |
|
Prime Cost % |
20% |
|
Guest Satisfaction |
10% |
|
Net Profit Margin |
5% |
Every location receives a total score out of 100. This creates a fair and objective ranking system across
your business.
Benefits include easier executive reporting, better manager accountability, faster operational
improvements, consistent performance reviews, and smarter expansion decisions.
How to Calculate Your Location Benchmark Score (Step by Step)
Here is the exact method, using three locations as a worked example.
Step 1: Choose your KPIs and weights
Pick 4–6 KPIs that directly drive profitability and assign weights that total 100% (use the scorecard above
as a starting point). Keep the same weights for every location and every period.
Step 2: Convert each KPI into a 0–100 score
Index each location against the best performer for that KPI: KPI Score = (Location Value ÷ Best Value) ×
100. For metrics where lower is better (like Prime Cost %), invert the formula: KPI Score = (Best Value ÷
Location Value) × 100.
Step 3: Multiply each score by its weight and add them up
Raw data for three locations
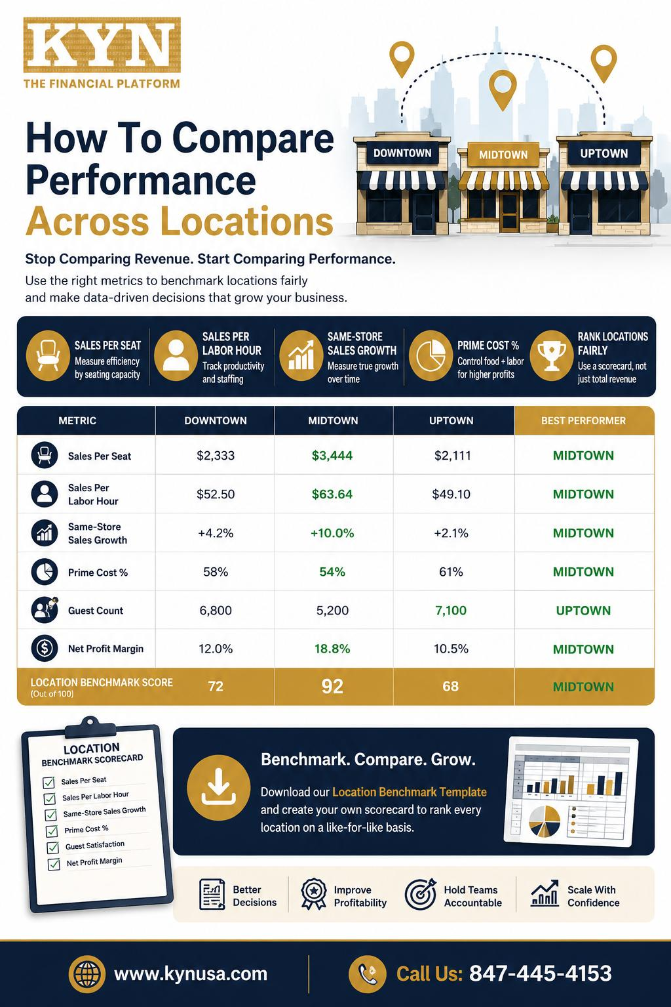
| KPI | Downtown | Midtown | Uptown |
|---|---|---|---|
|
Sales Per Seat |
$2,333 |
$3,444 |
$2,111 |
|
Sales Per Labor Hour |
$52.50 |
$63.64 |
$49.10 |
|
Same-Store Sales Growth |
+4.2% |
+10.0% |
+2.1% |
|
Prime Cost % |
58% |
54% |
61% |
|
Guest Satisfaction (of 5) |
4.4 |
4.5 |
4.7 |
|
Net Profit Margin |
12.0% |
18.8% |
10.5% |
Weighted points earned (KPI score × weight):
| KPI (Weight) | Downtown | Midtown | Uptown |
|---|---|---|---|
|
Sales Per Seat (25%) |
16.9 |
25.0 |
15.3 |
|
Sales Per Labor Hour (20%) |
16.5 |
20.0 |
15.4 |
|
Same-Store Growth (20%) |
8.4 |
20.0 |
4.2 |
|
Prime Cost % (20%) |
18.6 |
20.0 |
17.7 |
|
Guest Satisfaction (10%) |
9.4 |
9.6 |
10.0 |
|
Net Profit Margin (5%) |
3.2 |
5.0 |
2.8 |
|
LOCATION BENCHMARK SCORE |
73 |
100 |
65 |
Reading the result: Midtown is the fleet’s pace-setter—best on nearly every KPI. Downtown (73) is solid
but is leaking points on same-store growth. Uptown (65) wins on guest satisfaction, yet weak growth
and a 61% prime cost drag its score down—now you know exactly which two levers to pull.
Recalculate the score monthly with the same weights and the same formula, and you have a defensible,
like-for-like ranking that no manager can argue with.
Common Benchmarking Mistakes
Avoid these common errors when comparing restaurant performance across locations.
Comparing Only Revenue
Large stores naturally generate higher sales. Always normalize performance.
Ignoring Store Age
A location that’s been open for five years shouldn’t be compared directly with one that opened six
months ago. Use same-store comparisons whenever possible.
Ignoring Local Market Conditions
Different regions experience different customer demand, labor markets, and operating costs.
Benchmark within comparable market segments.
Using Too Many Metrics
Focus on a handful of KPIs that directly impact profitability. Too much data often creates confusion
instead of clarity.
Best Practices for Fair Restaurant Location Benchmarking
For consistent and meaningful benchmarking:
• Standardize your chart of accounts.
• Use the same reporting periods across all locations.
• Track KPIs weekly instead of monthly.
• Compare stores with similar formats.
• Normalize metrics for seating, labor, and customer traffic.
• Build a consistent executive scorecard.
• Review benchmark trends rather than isolated numbers.
When every location follows the same reporting standards, comparing restaurant performance across
locations becomes much more accurate
How KYN Helps You Compare Restaurant Performance Across Locations
Manual benchmarking often requires multiple spreadsheets and hours of analysis.
KYN (Know Your Numbers) simplifies the process by bringing your financial and operational data into
one centralized platform—built for multi-location operators who need to see what’s happening now,
not last month.
With KYN, restaurant operators can:
• Compare every location using standardized KPIs.
• Monitor sales per labor hour and prime cost in real time.
• Track same-store sales trends across reporting periods.
• Build executive dashboards with consistent benchmarking.
• Identify underperforming locations before small issues become major problems.
• Create a reliable Location Benchmark Score for every restaurant.
Instead of relying on disconnected spreadsheets, KYN gives multi-location operators the visibility they
need to make faster, data-driven decisions.
Final Thoughts
As your restaurant business expands, comparing locations fairly becomes increasingly important.
The most successful operators don’t rank stores by revenue alone. They normalize performance using
metrics such as sales per seat, sales per labor hour, same-store sales comparison, prime cost
percentage, and profitability.
Creating a Location Benchmark Score allows you to compare every restaurant on a like-for-like basis,
uncover hidden opportunities, reward high-performing managers, and improve overall business
performance.
When you consistently compare restaurant performance across locations using standardized
benchmarks, every decision becomes more informed—and every new location has a better chance of
long-term success.