

Restaurant Contribution Margin: Formula & Examples | KYN
 Nov 14,2026

Restaurant Contribution Margin 101: A Practical Guide for Independent Operators
Restaurant contribution margin: What each plate leaves after its variable costs.
THE SHORT ANSWER
Restaurant contribution margin is menu price minus the variable cost of one item: ingredients, packaging, card fees and delivery commissions. It shows the dollars each plate leaves for rent, salaries and profit. Rank dishes by those dollars, not only food cost %, then use the ratio to find break-even sales.
Two dishes can post the same food cost % and still leave very different cash in your till. Restaurant contribution margin shows the gap: the dollars each plate keeps after the costs that rise with every sale. That matters because the National Restaurant Association says the typical small-business restaurant runs on a 3-5% pre-tax margin, so one mispriced dish can wipe out the profit. Every example below is illustrative. Swap in your own recipe costs and prices.
KYN is a restaurant financial performance platform built from real operating data across 170+ units. It works alongside QuickBooks, Xero and NetSuite, not instead of them. For the idea behind the name, read What Does “Know Your Numbers” Mean?.
Key Takeaways
- Restaurant contribution margin = menu price − variable cost per item. It is what a plate leaves before fixed costs like rent.
- Contribution margin ratio = contribution margin ÷ menu price × 100.
- A dish with a higher food cost % can still earn more dollars per plate. Rank items by dollars, not only percentages.
- Use it for menu pricing, menu engineering, delivery pricing and break-even planning.
What Is Restaurant Contribution Margin?
Contribution margin is an item’s selling price minus the variable costs of making and selling it. What is left “contributes” to fixed costs, and once those are covered, it becomes profit.
- Variable costs rise with each sale: ingredients, takeout packaging, card processing fees and delivery app commissions.
- Fixed costs stay put whether you serve 50 covers or 500: rent, insurance, salaried managers and most software.
Food cost % shows how efficient a dish is. Contribution margin shows how many dollars it earns. You need both, but when you decide what to promote, reprice or cut, dollars per plate pays the bills.
What Is the Contribution Margin Formula?
Three versions cover most restaurant decisions.
Contribution margin per menu item
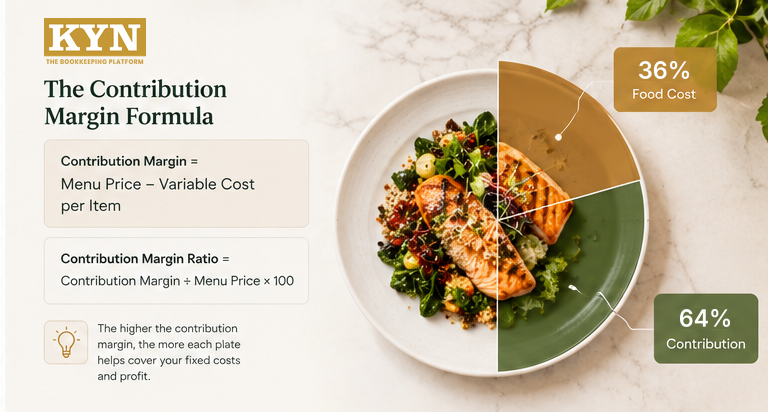
Contribution Margin ($) = Menu Price − Variable Cost per Item
Contribution margin ratio
Contribution Margin Ratio (%) = Contribution Margin ÷ Menu Price × 100
The ratio is the share of each sales dollar left after variable costs. You need it for break-even planning.
Total contribution margin
Total Contribution Margin = Contribution Margin per Item × Units Sold
This shows which items carry the week.
What counts as a variable cost?
At minimum, plate cost: every ingredient in one portion. For a fuller picture, add packaging, card fees, delivery commissions and item-linked discounts. Hourly labor is scheduled by shift, not per plate, so most operators track it through prime cost instead. Whatever rule you choose, apply it to every item.
How Do You Calculate Contribution Margin for a Menu Item?
Here is a simple comparison, using illustrative numbers for a casual restaurant.
| Menu Item | Price | Food Cost | Food Cost % | Contribution Margin | CM Ratio |
|---|---|---|---|---|---|
|
Smash burger |
$14.00 |
$4.20 |
30% |
$9.80 |
70% |
|
Grilled salmon |
$28.00 |
$10.08 |
36% |
$17.92 |
64% |
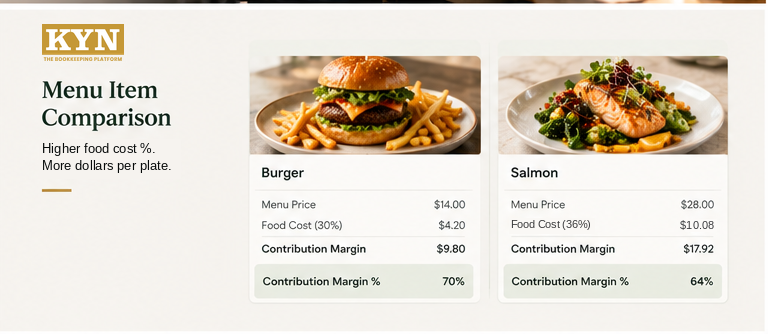
On food cost % alone, the burger wins. But the salmon leaves $17.92 a plate, $8.12 more than the burger. Now add volume. At 400 burgers and 90 salmon plates a week, the burger earns 400 × $9.80 = $3,920 and the salmon 90 × $17.92 = $1,612.80. The per-plate number tells you what to push. The total tells you what you cannot afford to get wrong.
Four steps to calculate it:
- Step 1: Cost the recipe. Add up every ingredient in one portion. Our restaurant food cost percentage guide walks through it.
- Step 2: Add other per-item variable costs, such as packaging or an estimated card fee.
- Step 3: Subtract the total from the menu price.
- Step 4: Multiply by units sold from your POS product mix report.
GET THE KYN RESTAURANT KPI GUIDE
The core numbers to track next to contribution margin: food cost, labor, prime cost and cash.
How Is Contribution Margin Different From Food Cost, Prime Cost and Profit Margin?
Each metric answers a different question.
| Metric | What it tells you | Formula | Best used for |
|---|---|---|---|
|
Food cost % |
Share of food sales spent on ingredients |
Food cost ÷ Food sales × 100 |
Purchasing and portion control |
|
Contribution margin |
Dollars each item leaves after variable costs |
Price − Variable cost per item |
Menu pricing and sales mix |
|
Prime cost |
Your two biggest controllable costs together |
Cost of goods sold + Total labor |
Weekly cost control |
|
Restaurant profit margin |
What is left after every cost |
Net profit ÷ Total sales × 100 |
Overall business health |
Restaurant profit margin is the bottom line, and it is thin. The NRA puts food and labor at roughly 33 cents each of every sales dollar for a typical restaurant. Together that is 66 cents, above the healthy prime cost benchmark of 60% of sales or less, which is why prime cost is the weekly number to watch. KYN’s Prime Cost Command Center tracks it for you. New to it? Start with our guide to restaurant prime cost.
How Do You Use Contribution Margin for Menu Pricing?
Contribution margin turns a pricing debate into simple math. Say you raise the burger from $14.00 to $15.00 with no change in food cost. The new margin is $15.00 − $4.20 = $10.80, up $1.00. To match the current $3,920 a week, you need $3,920 ÷ $10.80 = 363 burgers (rounded up). So the increase pays off as long as you keep selling at least 363 a week. You can lose up to 37, about 9% of volume, before it starts to hurt.
Set a contribution margin target in dollars for each menu category, not only a food cost % target. Re-check top sellers whenever a key supplier changes prices, and test price changes on one or two items at a time.
How Does Menu Engineering Use Contribution Margin?
Menu engineering sorts dishes by profit and popularity to decide what to promote, fix or remove. Within one category, compare each item’s contribution margin to the category average, and its sales to an equal share (1 ÷ the number of items, or 12.5% in a category of 8).
| Group | Contribution Margin | Popularity | What to do |
|---|---|---|---|
|
Stars |
High |
High |
Protect quality and placement. Avoid big price jumps. |
|
Plowhorses |
Low |
High |
Small price increase, smarter portioning or a cheaper ingredient. |
|
Puzzles |
High |
Low |
Better placement, a new description or server recommendations. |
|
Dogs |
Low |
Low |
Rework the recipe or remove it. |
Run it every quarter, or sooner when costs move. The goal is to shift your mix toward items that leave more dollars per plate.

Why Does Delivery Change Your Contribution Margin?
The same burger earns less through an app. DoorDash, for example, publishes delivery commissions of 15%, 25% or 30% depending on the plan (DoorDash merchant pricing). The table uses the 25% rate and a 3% card fee on dine-in. Both are examples, so use the rates in your own contracts.
| Line | Dine-In | Third-Party Delivery |
|---|---|---|
|
Menu price |
$14.00 |
$16.00 |
|
Food cost |
−$4.20 |
−$4.20 |
|
Packaging |
$0.00 |
−$0.60 |
|
Card processing (example 3%) |
−$0.42 |
$0.00 |
|
Delivery commission (example 25%) |
$0.00 |
−$4.00 |
|
Contribution margin |
$9.38 |
$7.20 |
|
CM ratio |
67% |
45% |
Illustrative numbers only. The dine-in burger shows $9.38 here, not $9.80, because this table adds the card fee. The delivery column assumes no separate card fee on app orders.
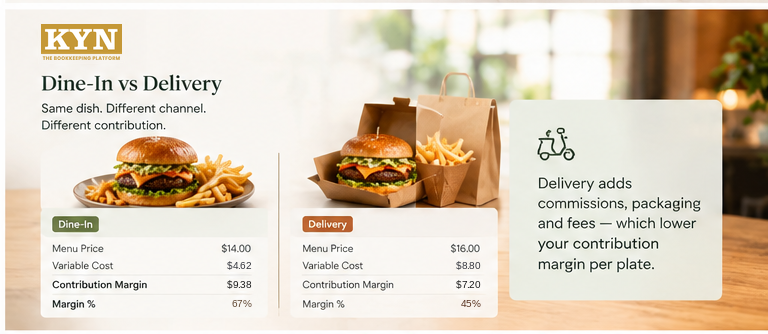
Even with a $2.00 higher price, the burger earns $2.18 less per delivery order. Calculate contribution margin by channel before you set delivery prices or run app promotions.
How Does Contribution Margin Set Your Restaurant Break-Even Point?
Your restaurant break-even point is the sales level where total contribution margin exactly covers fixed costs.
Break-Even Sales = Fixed Costs ÷ Contribution Margin Ratio
Use your weighted ratio: total contribution margin ÷ total sales across the menu. With $18,000 in weekly fixed costs and a 62% weighted ratio, break-even sales are $18,000 ÷ 0.62 = about $29,032 a week. Every dollar above that adds roughly 62 cents toward profit. Lifting the weighted ratio even a couple of points lowers the sales you need just to break even.
Should You Compare Contribution Margin Across Locations?
If you run more than one location, the same dish rarely has the same margin everywhere. Supplier prices, waste, portioning and channel mix all differ. Comparing top items by location is one of the fastest ways to spot a kitchen that needs attention. KYN’s Store Leaderboard™ is built for exactly this comparison, and our guide on how to compare restaurant performance across locations shows how to set it up.
Common Contribution Margin Mistakes
- Using recipe cost only. Plate cost ignores waste and over-portioning. Compare it with actual food cost every week.
- Ranking by percentage only. A low food cost % does not mean high dollars per plate.
- Ignoring channel costs. Commissions and packaging change which items are worth selling off-premise.
- Treating labor differently by item. Pick one rule and apply it to the whole menu.
- Using old costs. Update recipe costs from your own invoices whenever suppliers change prices.
- Checking once a year. Margins drift between menu updates, so review top items more often.
A Simple Weekly Contribution Margin Routine
Thirty focused minutes a week is enough for most restaurants.
- Step 1: Pull last week’s product mix report from your POS, such as Toast, Square or Clover.
- Step 2: Update recipe costs for your top 15 to 20 sellers if supplier prices moved.
- Step 3: Compare theoretical food cost with actual food cost from your books.
- Step 4: List your top five and bottom five items by total contribution margin.
- Step 5: Make one decision: a price, a placement, a portion or a promotion.
Between these reviews, KYN’s Daily Flash Report Matrix keeps the daily numbers in front of you. For more numbers to review alongside, see the top restaurant KPIs every owner must track.
Where Does KYN Fit on Top of Your Books?
KYN’s promise is “Not accounting. Performance.” It does not replace your books. It connects to QuickBooks, Xero and NetSuite, and to POS systems such as Toast, Square and Clover, and turns that data into clear weekly views of food cost, labor, prime cost and profitability by location. For menu decisions, KYN’s Menu Engineering & Item Profitability module shows which menu items make the most money based on real ingredient costs, Menu Mix Analysis shows how menu changes move profit across categories, and AI Copilot pinpoints specific margin drops. That turns the analysis in this guide into a weekly habit instead of a once-a-year spreadsheet project. See KYN for restaurants or the Prime Cost Dashboard.

Bottom Line
Restaurant contribution margin turns menu decisions into simple math. Know what each plate leaves after variable costs, rank dishes by dollars as well as percentages, check margin by channel, and use the weighted ratio to find your break-even sales. Review top sellers weekly and change one thing at a time. Download KPI Guide to track these numbers every week, or Book a Demo to see food cost, prime cost and profitability by location in one place.
FAQs
1 What is contribution margin in a restaurant?
2 How do you calculate contribution margin for a menu item?
3 What is a good contribution margin for a restaurant?
4 Contribution margin vs profit margin: what is the difference?
5 Is labor included in restaurant contribution margin?
KNOW YOUR NUMBERS. GROW WITH CONFIDENCE.
Location-level food cost, labor cost, prime cost, and cash visibility, running alongside the QuickBooks, Xero, or NetSuite books you already keep.
- About the author: The KYN Operating Team is the group of operators, accountants and business leaders behind KYN. Its founding team has managed, monitored and optimized 170+ multi-location restaurant and franchise entities, and writes every KYN guide from that operating experience. Meet the team.
Sources
- National Restaurant Association, Statement on the Introduction of the Raise the Wage Act of 2023 (July 25, 2023): typical small-business restaurant pre-tax margin of 3-5%; food and labor each about 33 cents of every sales dollar
- DoorDash Merchants, Commission rates and pricing: 15% (Basic), 25% (Plus) and 30% (Premier) on marketplace delivery
Know Your Numbers. Grow With Confidence. — kynusa.com