

Top 5 Restaurant KPIs Every Owner Must Track
 Jul 14,2026
Top 5 Restaurant KPIs Every Owner Must Track
Running a successful restaurant requires more than serving great food. The most profitable
restaurants consistently monitor restaurant KPIs that reveal exactly where money is earned—or
lost.
Many restaurant owners review sales every day but overlook the metrics that truly impact
profitability. Without tracking the right restaurant performance indicators, it’s difficult to
control food costs, labor expenses, and cash flow.
This guide explains the top five restaurant KPIs every owner must track, including formulas,
ideal benchmark ranges, and the actions each metric should trigger.
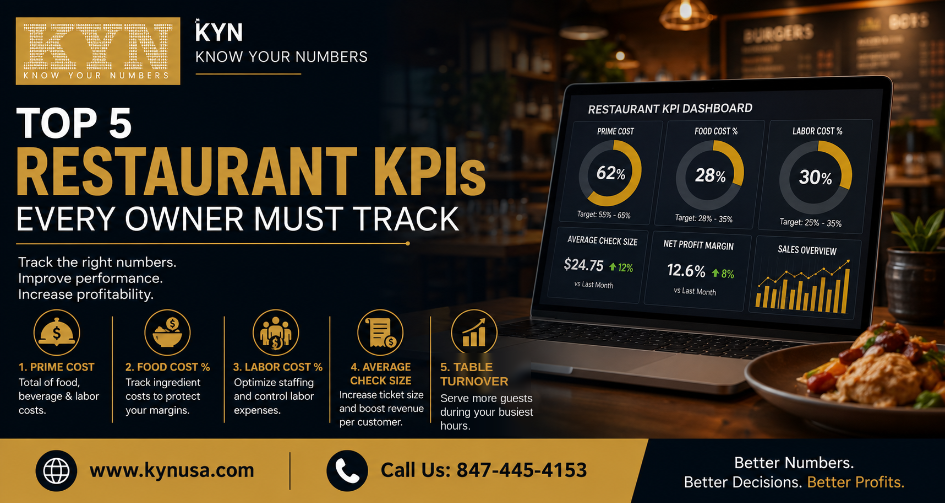
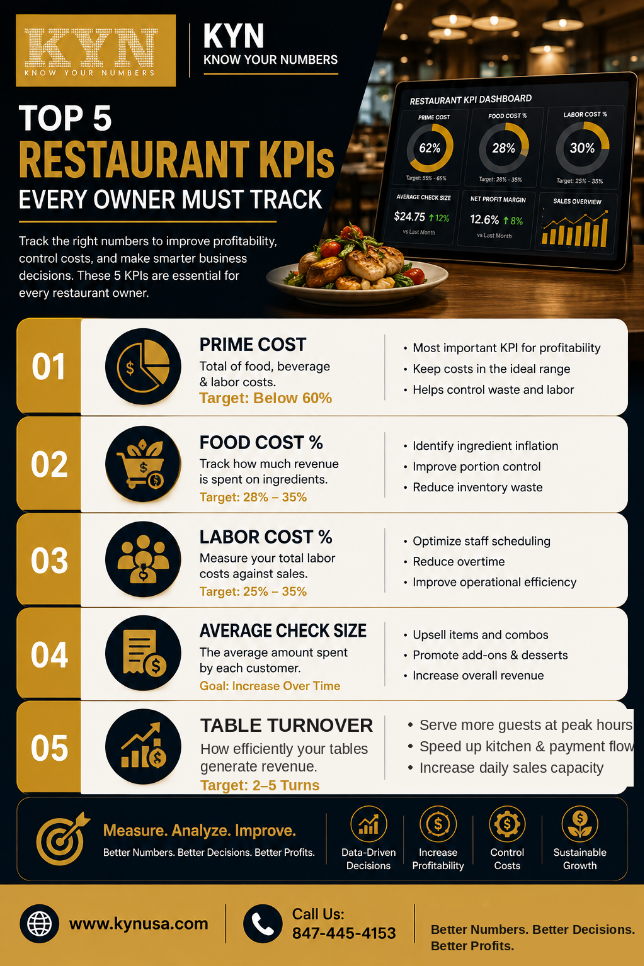
The Restaurant KPI Five: the five restaurant KPIs every owner must track are prime cost, food
cost percentage, labor cost percentage, average check, and table turnover. Each has a target
range and signals a specific action. Reviewing them weekly turns scattered data into a clear
picture of restaurant performance.
At KYN | Know Your Numbers, we build financial performance dashboards that put these five numbers in front of restaurant owners in real time — daily, not thirty days after the month
closes.
If you review these numbers weekly, you’ll make smarter business decisions and improve
long-term profitability.
Why Restaurant KPIs Matter
Restaurant KPIs (Key Performance Indicators) transform raw financial data into actionable
insights.
Instead of asking:
● “Did we have a good sales day?”
You’ll ask:
● Did food costs increase?
● Is labor too high?
● Are guests spending enough?
● Are tables turning fast enough?
● Are profits improving?
These answers allow restaurant owners to solve problems before they become expensive.
1. Prime Cost
What Is Prime Cost?
Prime Cost combines your two biggest operating expenses:
● Food & Beverage Cost
● Labor Cost
For most restaurants, these expenses account for nearly 60–70% of total sales.
Formula
Prime Cost = Cost of Goods Sold + Total Labor Cost
Prime Cost Percentage Formula
Prime Cost % = (Prime Cost ÷ Total Sales) × 100
Ideal Target
Below 60%
Fine dining:
55–60%
Fast Casual:
58–62%
Quick Service:
55–60%
What This KPI Signals
If Prime Cost rises:
● Food waste may be increasing
● Labor scheduling may be inefficient
● Menu pricing may need adjustment
● Purchasing costs may have increased
Prime Cost is considered the single most important restaurant KPI because it reflects operational efficiency.
Go deeper: see how the KYN prime cost dashboard tracks this number in real time across every
location.
2. Food Cost Percentage
Food Cost Percentage measures how much of your sales revenue is spent on ingredients.
Formula
Food Cost % = (Food Cost ÷ Food Sales) × 100
Target Benchmark
Most restaurants:
28%–35%
Pizza:
22–28%
Steakhouse:
30–38%
Fine Dining:
30–35%
What This KPI Signals
A higher food cost percentage may indicate:
● Portion control issues
● Ingredient theft
● Vendor price increases
● Excessive food waste
● Poor inventory management
Weekly monitoring allows owners to identify problems before they affect profitability.
3. Labor Cost Percentage
Labor is the second-largest expense for most restaurants.
Tracking labor costs ensures staffing levels align with revenue.
Formula
Labor Cost % = (Total Labor Cost ÷ Total Sales) × 100
Ideal Target
25%–35%
Quick Service:
25–30%
Casual Dining:
28–33%
Fine Dining:
30–35%
What This KPI Signals
A high labor percentage could mean:
● Overstaffing
● Low customer traffic
● Overtime costs
● Inefficient scheduling
A labor percentage that’s too low may hurt customer service and employee morale.
Finding the right balance is essential.
Labor is also the KPI owners most often review too late — see how the KYN platform surfaces
labor cost against sales daily, so scheduling decisions happen before payroll runs.
4. Average Check
Average Check shows how much each customer spends during a visit.
Increasing this metric often improves profits without attracting additional guests.
Formula
Average Check = Total Sales ÷ Number of Guest Checks
Typical Target
The ideal benchmark varies by restaurant concept.
Instead of comparing yourself to competitors, focus on increasing your own average over time.
Ways to Improve Average Check
● Upsell appetizers
● Recommend desserts
● Bundle meals
● Offer premium beverages
● Train servers on suggestive selling
Even a small increase in average check can significantly improve annual revenue.
5. Table Turnover Rate
Table Turnover measures how efficiently seating capacity is utilized.
Restaurants with high demand often increase revenue simply by serving more guests during
peak hours.
Formula
Table Turnover = Number of Parties Served ÷ Number of Tables
General Target
Casual Dining:
2–3 turns
Fast Casual:
3–5 turns
Quick Service:
Higher depending on service model
What This KPI Signals
Low turnover may indicate:
● Slow kitchen operations
● Long payment times
● Poor table management
● Reservation scheduling issues
Improving turnover without rushing guests can substantially increase daily sales
The Restaurant KPI Five in Action: A Worked Example
Here is how the five KPIs work together in practice. A 30-table neighborhood bistro finishes the
week with $30,000 in total sales ($27,000 food, $3,000 beverage), $8,700 in food and beverage
costs (of which $8,100 is food), $9,600 in total labor, and 1,200 guest checks across lunch and
dinner.
Prime Cost: $8,700 + $9,600 = $18,300 → 61% of sales. One point above the 60% ceiling — a
warning, not a crisis.
Food Cost %: $8,100 ÷ $27,000 = 30%.
Comfortably in the 28–35% range, so the overage is not
coming from the kitchen.
Labor Cost %: $9,600 ÷ $30,000 = 32%. Within range overall, but high for a casual concept
(28–33%) — this is where the prime cost problem lives.
Average Check: $30,000 ÷ 1,200 checks = $25, up from $24 the week before after servers began
suggesting desserts.
Table Turnover: 1,200 parties ÷ 30 tables = 40 turns for the week, about 2.9 per service — right
in the casual-dining range.
The decision writes itself: food, check size, and turnover are healthy, so the owner trims roughly
six scheduled labor hours per day. The following week, prime cost lands at 60% — found in a
ten-minute weekly review, fixed before month-end.
Quick KPI Cheat Sheet
| Restaurant KPI | Formula | Ideal Target | Signals |
|---|---|---|---|
|
Prime Cost |
Food Cost + Labor Cost |
Under 60% |
Overall operational efficiency |
|
Food Cost % |
Food Cost ÷ Food Sales
×100 |
28–35% |
Inventory and purchasing
control |
|
Labor Cost % |
Labor Cost ÷ Sales ×100 |
25–35% |
Staffing efficiency |
|
Average Check |
Sales ÷ Guest Checks |
Increase over
time |
Upselling opportunities |
|
Table Turnover |
Parties Served ÷ Tables |
2–5 turns |
Seating efficiency |
Want this table on one printable page? Download the free Restaurant KPI Cheat Sheet —
every formula, target range, and action signal in this guide, ready to pin up in your office.
How Often Should Restaurant Owners Review KPIs?
Successful operators don’t wait until the end of the month.
Recommended schedule:
Daily
● Sales
● Average Check
● Table Turnover
Weekly
● Prime Cost
● Food Cost
● Labor Cost
Monthly
● Profit Margin
● Cash Flow
● Inventory Trends
Frequent reviews help identify trends before they become costly problems.
Common Mistakes Restaurant Owners Make
Many restaurants collect data but fail to act on it.
Common mistakes include:
● Tracking only sales
● Ignoring labor efficiency
● Reviewing KPIs too late
● Comparing against unrealistic benchmarks
● Not sharing KPI goals with managers
The goal isn’t just measurement—it’s making informed decisions based on reliable data
Why the Restaurant KPI Five Matter Together
Each KPI tells part of the story, but together they provide a complete view of restaurant
performance.
For example:
● High sales with poor Prime Cost may still result in low profits.
● Strong Average Check won’t offset excessive Labor Cost.
● Low Food Cost is less meaningful if Table Turnover is weak.
When monitored collectively, these restaurant metrics to track help owners identify the real
drivers of profitability. That is why we call them the Restaurant KPI Five — five numbers, one
complete picture.
Why Restaurant Owners Choose KYN | Know Your Numbers
Tracking the Restaurant KPI Five in spreadsheets works — until it doesn’t. Numbers arrive weeks
late, formulas break, and multi-location owners end up managing five versions of the truth.
KYN | Know Your Numbers is a financial performance platform built by operators with 170+
locations of real experience. It sits on top of your POS and accounting systems and turns them
into a live KPI dashboard — prime cost, food cost, labor, average check, and table turnover for
every location, updated daily instead of thirty days later. You can’t improve what you can’t
clearly see.
Final Thoughts
Every successful restaurant owner knows their numbers—not just their sales.
By consistently tracking restaurant KPIs like Prime Cost, Food Cost Percentage, Labor Cost
Percentage, Average Check, and Table Turnover, you gain the insights needed to make faster,
smarter decisions.
Rather than relying on intuition, use these key numbers for restaurant owners to optimize
staffing, control costs, improve guest spending, and increase profitability over time.
The best-performing restaurants review these metrics regularly, act on the trends they reveal,
and build systems that keep financial performance on track.
Ready to put the Restaurant KPI Five to work? Download the free Restaurant KPI Cheat Sheet
to start your weekly review, or book a demo with KYN to see your own numbers in real time.
FAQs
1 What are restaurant KPIs?
2 Which restaurant KPI is most important?
3 How often should restaurant KPIs be reviewed?
4 What is a good Prime Cost percentage?
5 Why should restaurant owners track KPIs?
How can KYN | Know Your Numbers help restaurants track KPIs?
KYN is a financial performance platform that connects to your POS and accounting systems and
turns them into a live restaurant KPI dashboard. Owners see prime cost, food cost, labor cost,
average check, and table turnover across every location, updated daily — so problems are
caught in days, not at month-end. Learn more at kynusa.com.