
5 Signs Your Restaurant Needs a Financial Performance Management Platform | KYN
 Oct 31,2026

5 Signs Your Restaurant Needs a Financial Performance Management Platform
Restaurant financial performance management brings daily sales, food cost, labor cost, prime cost, and cash into one financial dashboard, so operators catch profit margin problems while there is still time to fix them — not three weeks after the month closes.
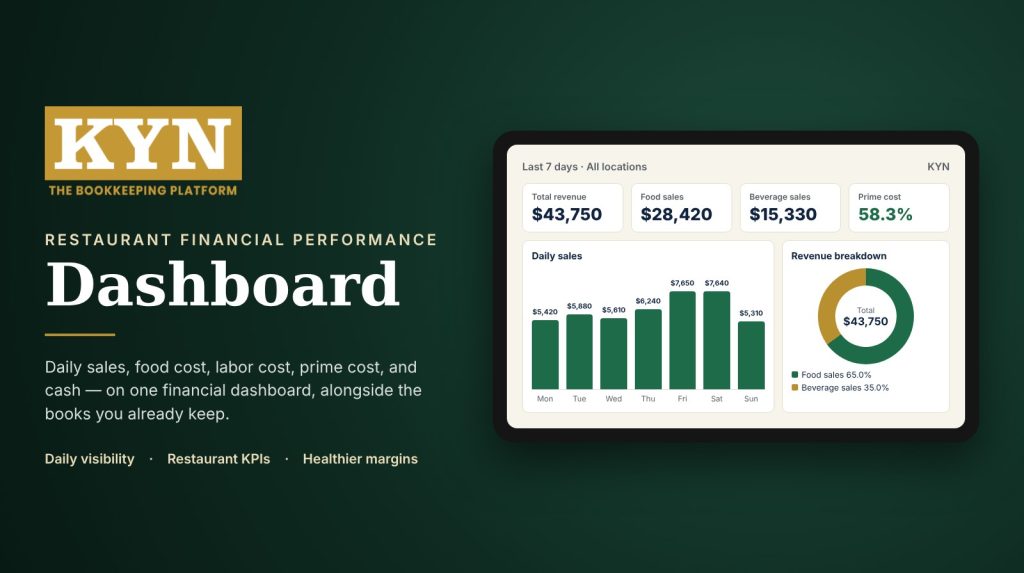
Restaurant financial dashboard in KYN: seven days of sales, food and beverage revenue, and prime cost on one screen.
Running a restaurant takes more than tracking sales. Yet many operators still rely on reports that explain what happened after the fact, and by the time a monthly P&L shows a food or labor problem, the chance to fix it has passed.
That is where restaurant financial performance management comes in: operational and financial data in one place, monitored often enough to catch changes early. For the framework behind it, start with What Does Know Your Numbers Mean?.
But how do you know when your restaurant actually needs one? Here are five signs to look for.
Why Do Restaurants Need Financial Performance Management?
Restaurant financial performance management is the process of continuously monitoring financial and operating metrics such as sales, food cost, labor cost, prime cost, cash flow, and profitability.
Accounting still matters. It keeps your records, taxes, and compliance in order. But it tells you what happened, not what is happening now.
Financial performance management fills that gap. Restaurant analytics software built for operators turns the books you already keep into restaurant KPIs your managers can act on this week.
That is KYN in one line: Not accounting. Performance. KYN is the performance layer on top of QuickBooks, Xero, or NetSuite. It never replaces them.
Sign 1: You Wait Until Month-End to Understand Profitability
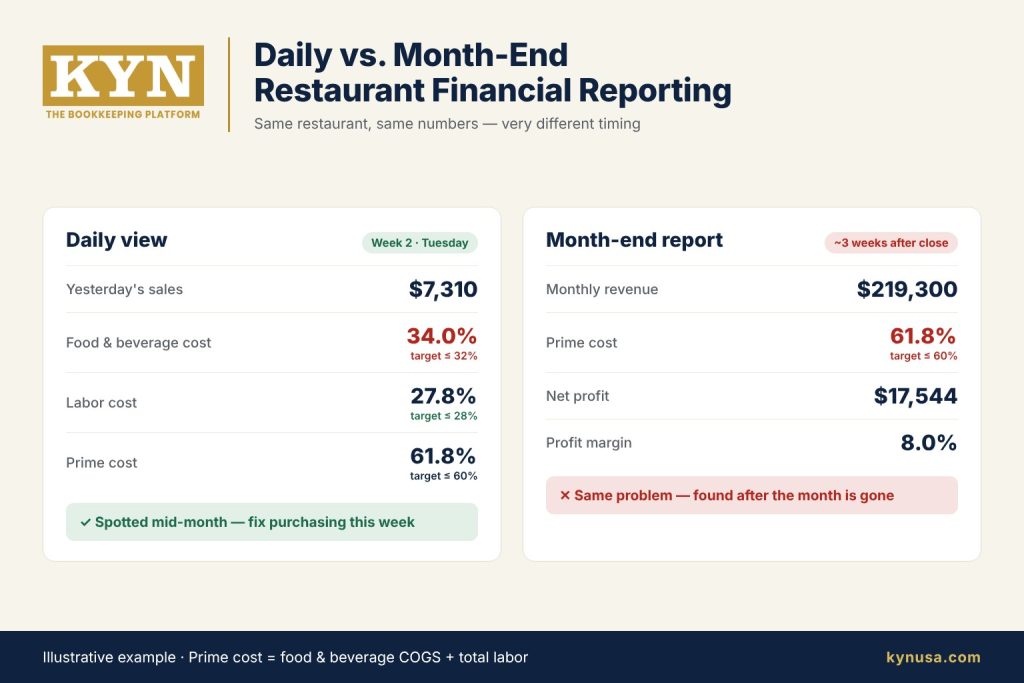
The clearest warning sign: you don’t know how profitable your restaurant is today. You know yesterday’s sales and your bank balance, but revenue alone hides rising food, labor, and delivery costs.
Why Delayed Reporting Creates a Problem
Picture three strong weeks of sales, then a month-end report showing food cost jumped. By then, weeks of purchasing, waste, and pricing decisions are already locked in.
KYN’s Daily Flash Report Matrix fixes the timing. Every morning it puts yesterday’s sales, food cost, labor cost, prime cost, and cash position on one financial dashboard: restaurant KPI software that catches a shift mid-week instead of at month-end.
Key takeaway: Financial information becomes more useful when your team can act on it while the period is still in progress.
Sign 2: Food and Labor Costs Keep Surprising You
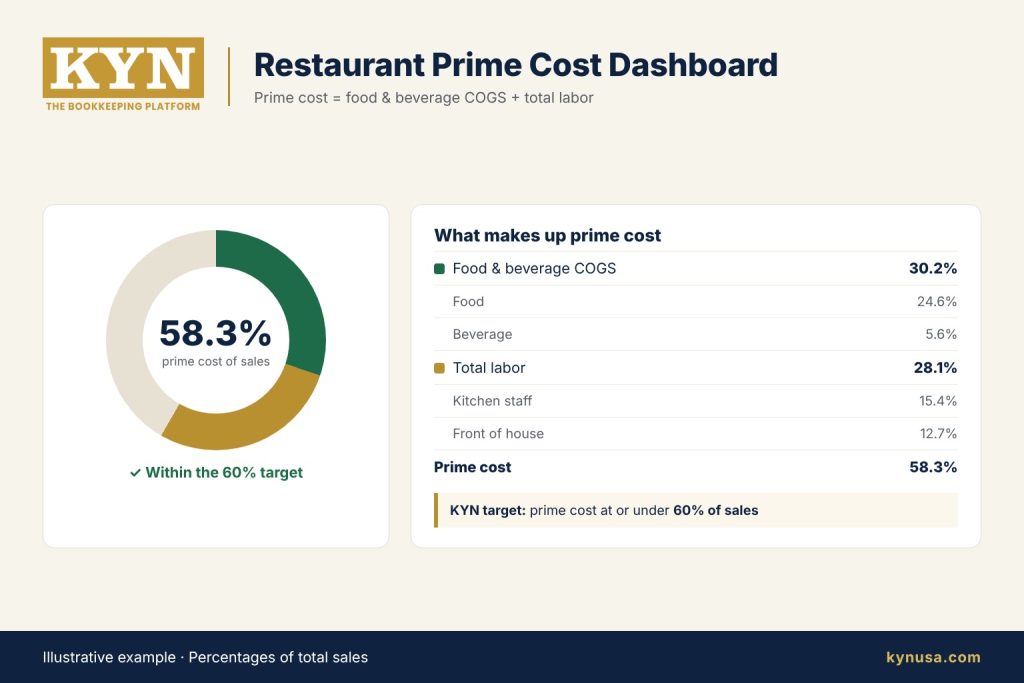
Food and labor are the two biggest controllable costs in a restaurant. Together they make up prime cost (food and beverage COGS plus total labor), and KYN’s target is 60% of sales or less. When either moves unexpectedly, profit margin moves with it.
The National Restaurant Association’s 2025 Restaurant Operations Data Abstract, based on 2024 data, put median labor costs (salaries and wages including benefits) at 36.5% of sales for full-service operators and 31.7% for limited-service operators.
Those are medians, not targets. Many operators carry more labor than their margins can support, which is exactly why weekly monitoring matters. Common warning signs include overtime creeping up, labor percentage moving above target, repeated inventory variance, and sales growing slower than labor expenses.
| Metric | Healthy Range | Warning Sign |
|---|---|---|
|
Food Cost % |
28% – 32% |
Trending above 33% for more than a week |
|
Labor Cost % |
25% – 28% |
Above 30%, or rising while sales are flat |
|
Prime Cost % |
60% or less |
Above 60% for two weeks running |
|
Cash Position |
Stable or growing week over week |
Declining despite reported profit |
Sign 3: You Manage Multiple Locations Using Separate Reports
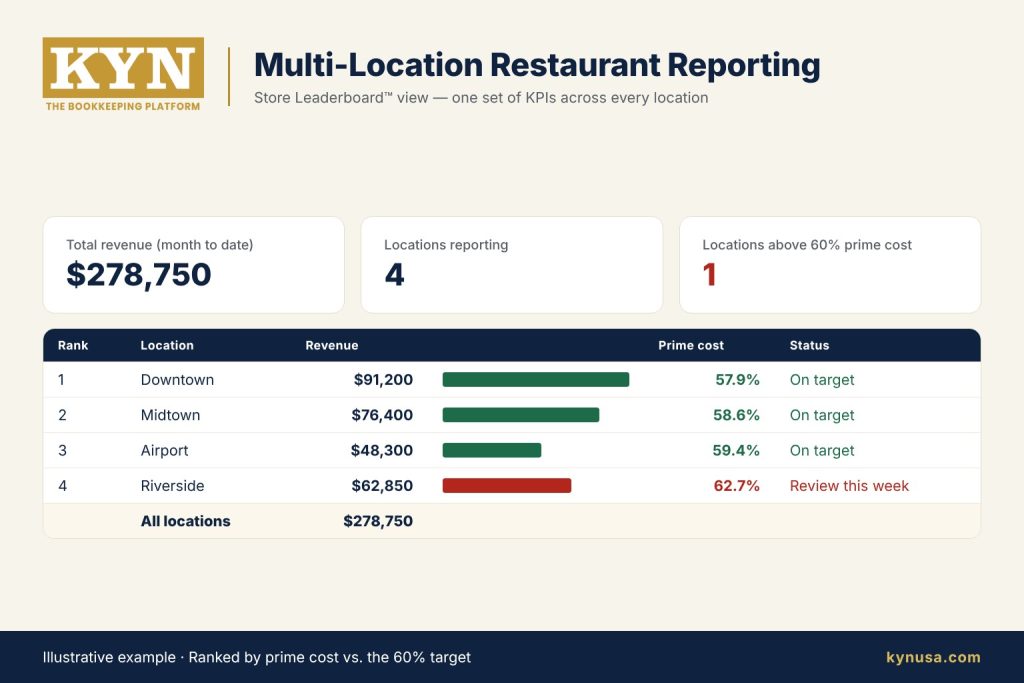
Managing five, ten, or twenty locations adds a new problem: consistency. Each location has its own sales, costs, vendors, and profit margins.
If every location is managed through separate spreadsheets and reports, comparing performance becomes harder.
What Multi-Location Operators Need
A centralized view lets management compare revenue, food cost %, labor cost %, prime cost, cash position, and budget vs. actual across every location. KYN’s Store Leaderboard™ ranks every location on the same restaurant KPIs, and its multi-location restaurant reporting consolidates each entity into one view, with shared expense allocation built in.
Sign 4: Your Cash Position Is Difficult to Understand
Another warning sign: the P&L says you made a profit, but the bank balance is lower. Why?
Profit and cash are related but not identical: cash can be affected by inventory purchases, payroll timing, loan payments and taxes, and equipment purchases.
Good records tell you what happened. Operators also need to see what is happening now: how much cash is already committed to payroll, vendors, and debt payments this week.
KYN puts cash position on the same financial dashboard as sales, prime cost, and location performance, so profit and cash never drift apart unnoticed. For a deeper walkthrough, read understanding restaurant cash flow.
Sign 5: Your Team Has Data but Not Actionable Insights
Restaurants today generate enormous amounts of data — POS, payroll, accounting software, inventory, and banking each show a piece of the picture.
The problem is rarely a lack of data. A manager may see sales up 8% and call it good news. But if labor rose 14% and food cost rose 5% in the same period, the restaurant is less efficient than before.
The sales number alone can’t answer that. This is why restaurant financial performance management, and the restaurant analytics software behind it, connects multiple KPIs instead of reading numbers in isolation.
SEE YOUR OWN NUMBERS IN KYN
Start a free trial and see your sales, food cost, labor cost, and prime cost on one financial dashboard.
What Should Restaurant KPI Software Track?
Good restaurant KPI software makes the important numbers easy to monitor: sales by day, week, location, and channel; food and labor cost against sales; prime cost, tracked against the 60% target on a prime cost dashboard; cash position; profit margin, not just revenue; and, for multi-unit groups, every location on the same KPIs.
How KYN Helps Restaurants Improve Financial Visibility
KYN is the financial performance layer that works alongside your existing accounting system, so you keep QuickBooks, Xero, or NetSuite. Built from real operating data managing 170+ units, KYN’s restaurant financial performance platform includes the Daily Flash Report Matrix for daily sales and cost tracking, the Prime Cost Command Center for food and labor monitoring, the Store Leaderboard™ for comparing locations, and an AI Copilot that flags changes worth a closer look. It connects with POS systems including Toast, Square, and Clover, and payroll platforms including ADP, Gusto, Rippling, and Paychex.
For a restaurant group, that means one platform doing two jobs: restaurant analytics software for daily decisions and restaurant KPI software across every location, with the books left exactly where they are.
What Is a Practical Workflow for Monitoring Restaurant Financial Performance?
Keep it to four steps: centralize sales, cost, cash, and location data in one view; set targets for food cost, labor cost, and prime cost; check them daily or weekly; and act on what changed this week, not on next month’s report.
Common Mistakes Restaurants Make With Financial Reporting
A few habits separate restaurants that catch problems early from those that don’t:
- Waiting for month-end reports instead of watching numbers weekly
- Tracking revenue without cost context
- No standardized KPIs across locations
- Treating cash and profit as the same thing
- Collecting data without a clear, connected view
Final Takeaway
A restaurant doesn’t necessarily need more spreadsheets or more reports. It needs the right information at the right time.
Month-end surprises, food and labor costs that keep jumping, locations run on disconnected reports, cash you can’t explain: any one of these means it is time for a restaurant financial performance management platform.
Not accounting. Performance. KYN keeps your books where they are and brings sales, costs, profit margin, cash, and location performance into one financial dashboard. Start a free trial and see your own numbers this week.
READY TO KNOW YOUR NUMBERS?
Start your free trial and see location-level food cost, labor cost, prime cost, and cash alongside the QuickBooks, Xero, or NetSuite books you already keep.
FAQs
1 What is restaurant financial performance management?
2 What is restaurant analytics software?
3 What is the difference between accounting and financial performance management?
4 What KPIs should restaurants monitor?
5 Why is prime cost important for restaurants?
6 Can a financial performance platform work with existing accounting software?
7 How often should restaurant financial data be reviewed?
Sources
National Restaurant Association — Restaurant Labor Costs Are Well Above Historical Averages
Know Your Numbers. Grow With Confidence. — kynusa.com