

Working Capital & the Cash Conversion Cycle: Freeing Up Cash You Already Have
KYN Insights
Operator Playbooks · Mohan Patel
Cash Clarity for Multi-Location Operators
6
Series · Cash Clarity for Multi-Location Operators
Part 3 of 6
Working Capital & the Cash Conversion Cycle: Freeing Up Cash You Already Have
Before you borrow or chase more sales, look at the cash already trapped inside your operation — and the three levers that release it.

Mohan Patel
Founder, KYN
On this page
For years, whenever cash got tight, my instinct was the same one most operators have: go get more. More sales, more volume, maybe a line of credit to smooth things out. It took me longer than I’d like to admit to see that I was standing on top of the cash I needed.
One quarter, genuinely frustrated, I sat down and traced where every dollar actually lived. What I found stopped me cold: I was carrying nearly a month of inventory I didn’t need — food and supplies sitting on shelves, bought with cash — and my catering invoices were going out two and three weeks after the event. Between the two, I had six figures of my own money parked in the business, doing nothing, while I was out shopping for a loan to cover the same gap.
I didn’t need more revenue. I needed to stop trapping the revenue I already had.
We tightened ordering, invoiced the day we delivered, and used our supplier terms instead of paying early out of habit. Within a couple of months we’d freed up a serious amount of cash — enough to fund a remodel I’d assumed I’d have to borrow for. Same sales. Same margins. The money had been there the whole time.
That’s what this article is about: the cash you’ve already earned that’s hiding inside your own operations — and how to get it back.
The Short Answer
THE SHORT ANSWER
Working capital is the cash tied up running your day-to-day business — money sitting in inventory and unpaid invoices, minus what you still owe suppliers. The cash conversion cycle (CCC = DIO + DSO − DPO) measures how many days your own cash is locked up before it comes back. Shrink that cycle and you release cash you already have — no loan, no extra sales required.
Most operators try to fix a cash problem by adding revenue. Often the faster fix is freeing the cash already trapped inside the business. Here’s how it works.
What Working Capital Really Is
Textbooks define working capital as current assets minus current liabilities. Useful, but here’s the operator’s version: working capital is the cash your business needs tied up just to keep running. It’s the money sitting in the walk-in as inventory. It’s the revenue you’ve earned but haven’t collected. It’s offset by the bills you haven’t paid yet.
When people say a business is “cash-hungry,” this is usually what they mean. Every dollar in excess inventory and every dollar in uncollected invoices is a dollar of yours the business is holding hostage. It doesn’t show up as a problem on your P&L — it’s not an expense, it’s just your cash, stuck. And the faster you grow, the more of it gets swallowed. That’s the same cash gap from earlier in this series, seen from the inside.
The Cash Conversion Cycle
The cleanest way to measure how long your cash is trapped is the cash conversion cycle. It answers one question: from the moment you pay for something to the moment the cash comes back, how many days are you funding the business out of your own pocket?
It’s three numbers:
- DIO — Days Inventory Outstanding. How long inventory sits before it’s sold. Cash frozen on the shelf.
- DSO — Days Sales Outstanding. How long after a sale before you actually collect. For most restaurant covers this is a day or two; for catering, house accounts, and B2B it can stretch for weeks.
- DPO — Days Payable Outstanding. How long you take to pay your suppliers. This one works for you — the longer your terms, the longer you hold your cash.
CCC = DIO + DSO − DPO
Put simply: your cash goes out when you pay your supplier, and comes back when your customer pays you. The days in between are the cash conversion cycle.
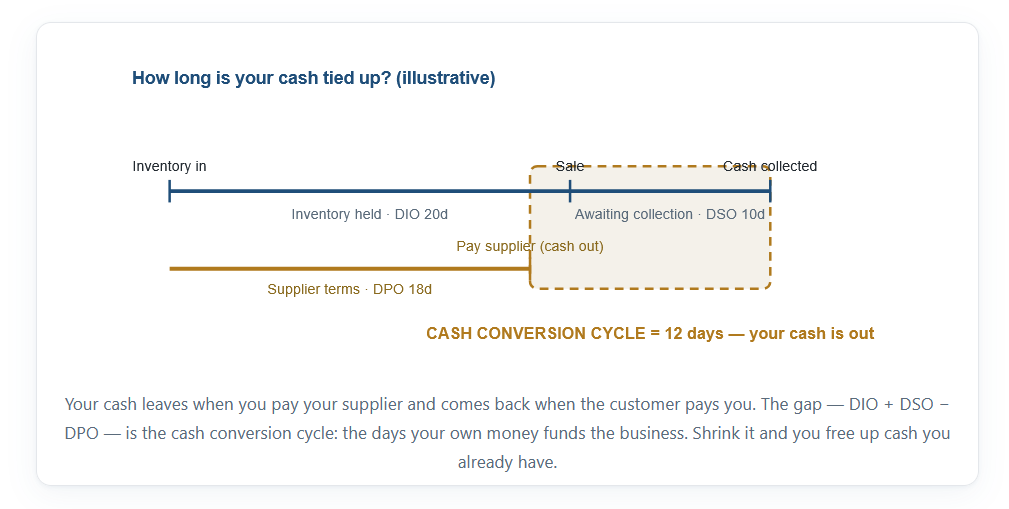
The lower the number, the less of your own cash is tied up. Get it to zero and your suppliers are effectively financing your operations. Let it balloon — too much stock, slow collections, paying too early — and you’ll feel permanently short of cash even in a profitable year.
The KYN Cash Release Method™
Shrinking the cycle comes down to three levers. Pull any one and you free up cash; pull all three and the effect compounds.
1
Turn it faster (DIO)
Order to demand, tighten par levels, and kill spoilage. Every day of inventory you don’t carry is cash back in your account instead of on the shelf.
2
Collect it sooner (DSO)
Deposit daily, invoice catering and house accounts the day you deliver, and shorten terms. The faster money lands in the bank, the less of yours is out on loan to customers.
3
Time your payments (DPO)
Use the full supplier terms you’ve already been given and negotiate for more — without missing early-pay discounts or straining the suppliers you depend on. Hold your cash as long as it’s fair to.
What Ten Days Is Worth
The reason this matters so much is leverage. Suppose you run about $300,000 a month — roughly $10,000 of cash flowing through per day. If your cash conversion cycle is 18 days, you’ve got around $180,000 of your own money permanently tied up just to operate. Trim that cycle to 8 days — ten days faster — and you release roughly $100,000 in cash you already earned. No loan. No new customers. Just money that stops being trapped.
Now multiply that across locations. Ten days off the cycle in five units isn’t $100,000 — it’s closer to half a million dollars of working capital freed up, sitting in your account instead of on someone’s shelf or someone’s unpaid invoice. That’s the quiet superpower of working capital: small changes in days translate into large changes in cash.
What This Looks Like in Real Life
An operator I worked with was convinced he needed financing to get through a slow stretch. His P&L was fine; his bank account never was. When we mapped his cycle, two things jumped out: he was carrying nearly 30 days of inventory “just to be safe,” and his catering arm was invoicing two to three weeks after events.
We didn’t touch his sales. We right-sized his ordering to actual usage and moved catering to invoice-on-delivery with tighter terms. Within about two months his cash conversion cycle dropped by double digits and he’d freed up enough working capital to cover the slow stretch himself — the loan he thought he needed never got signed. (Illustrative, drawn from a pattern I’ve seen many times.)
The Mistakes That Keep Cash Trapped
- Chasing sales to fix a working-capital problem. More revenue that collects slowly can make your cash worse. Sometimes the fastest cash is already inside the business.
- Stretching payables too far. Holding your cash is smart; burning key suppliers or blowing past early-pay discounts to do it is not. Time payments, don’t abuse them.
- Letting inventory creep. “Just in case” ordering is dead cash on the shelf — and in a kitchen, some of it literally spoils. Par levels beat hunches.
- Measuring it once a year. Working capital drifts week to week. If you only look at your cycle at tax time, you’ll never catch it tightening until it hurts.
What I Finally Did About It
The hard part isn’t understanding the cash conversion cycle — it’s seeing it, live, across every location, without a finance team rebuilding a spreadsheet every month. My inventory days, collection days, and payables don’t sit still, and neither do yours. By the time a year-end report shows the cycle crept up, the cash is already gone.
So I built the view I wanted. That’s the KYN Financial Platform. On the hard rule that your books are clean and reconciled first, it tracks your cash conversion cycle and its three levers across every location, and shows you where your cash is trapped right now — which location is over-ordering, where collections are slipping, how much working capital you could release this quarter. It turns “I feel broke even though we’re profitable” into “here are the exact days and dollars to go free up.”
I ran my own business on it for five years before I offered it to anyone else — and freeing trapped working capital was one of the first things it paid for.
The KYN Decision Framework
Every article in this series comes back to the same five-step loop — the one I run my own business on:
THE KYN DECISION FRAMEWORK
- Know Your Books — start from clean, reconciled numbers. Nothing downstream works without this.
- Know Your Numbers — see cash and profit together, across every location.
- See the Trend — look weeks ahead, not just back at last month.
- Make the Decision — act while you still have room to change the outcome.
- Review Every Week — make it a standing habit, not a fire drill.
Key Takeaways
THE 5 THINGS TO REMEMBER
- Working capital is your own cash tied up in inventory and unpaid invoices, minus what you still owe suppliers.
- The cash conversion cycle — DIO + DSO − DPO — measures how many days that cash is locked up.
- Shrinking the cycle releases cash you already have: no loan, no extra sales.
- Three levers: turn inventory faster, collect sooner, time your payables — pull all three and the effect compounds.
- A few days off your cycle can free five- or six-figure sums, multiplied across every location.
Common Questions
1 What is working capital?
2 What is the cash conversion cycle and how do I calculate it?
3 How can I free up cash without taking a loan?
4 What is a good cash conversion cycle for a restaurant?
5 How is working capital different from profit?
The cheapest money you’ll ever raise is the cash already trapped in your own operation. Free it before you borrow it. Right Numbers. Right Time. Right Decisions.
Curious how much working capital you could release across your locations? Book a KYN demo and I’ll walk you through it personally — we’ll find the cash already hiding in your business.
GET THE TOOL
Want to measure your own cycle? Download the free Cash Conversion Cycle Worksheet — a simple spreadsheet that calculates your DIO, DSO, DPO and CCC, and estimates the cash you could release by trimming a few days.
IF YOU REMEMBER ONE THING
Before you borrow or chase more sales, look inside: the cash you need is often already there, trapped in inventory and unpaid invoices. Shorten the cycle and set it free.
Numbers don’t make decisions. Owners do. The right numbers simply help you make the right one.
Mohan Patel
Founder, KYN USA
Mohan Patel has spent more than 30 years in the trenches of multi-location operations. He founded KYN after watching too many profitable operators get blindsided by cash, and he still runs his own business on the platform every week — because better decisions start with better visibility.
KYN is the Financial Performance Platform for multi-location operators.
- 30+ years in restaurant operations
- Managed 170+ restaurant locations
- Helped 500+ business owners
- Founder of the KYN Financial Performance Platform
30+
years operating
500+
owners advised
170+
locations run
6
states