

The 13-Week Cash Flow Forecast: Seeing Trouble Before It Arrives
KYN Insights
Operator Playbooks · Mohan Patel
Cash Clarity for Multi-Location Operators
6
Series · Cash Clarity for Multi-Location Operators
Part 2 of 6
The 13-Week Cash Flow Forecast: Seeing Trouble Before It Arrives
A month-end P&L tells you what already happened. A rolling 13-week forecast shows you the cash crunch while you still have time to prevent it — here’s how to build one.

Mohan Patel
Founder, KYN
On this page
One Monday morning, early in my multi-location days, I was reviewing numbers with one of my restaurant managers. Sales looked healthy. Margins looked healthy. Everyone in the room felt good about where we were.
Then I opened the cash forecast. Six weeks out, payroll was going to be short.
Nothing on the P&L had warned me — the month looked like a win. But laid out week by week, the cash told a different story: a quarterly tax payment, an insurance premium, and an ordinary payroll run were all going to land in the same seven days, and the account wasn’t going to cover it.
Because I saw it six weeks early, it was a scheduling problem, not a crisis. We staggered the timing, moved one commitment, and payroll cleared without anyone outside that room ever knowing how close it had been. Seen on payday instead, it would have been a very different Monday.
I’ve since watched dozens of operators live out that same near-miss. The difference, every single time, was whether they were looking 13 weeks ahead or waiting for the month to close. Your monthly statements are a rear-view mirror. A 13-week forecast is the windshield.
The Short Answer
THE SHORT ANSWER
Profit doesn’t pay your bills — cash does. Growing operators run out of money because expansion ties up cash in inventory, payroll, and buildout before the new revenue lands. The cash gap, not the P&L, is what sinks profitable restaurants. Track cash and profit together.
That’s the concept in a paragraph. The value is in building it correctly and reading it every week — so let’s do both.
What a 13-Week Forecast Actually Is
Most owners run their business on two documents: the P&L and the bank balance. The P&L tells you whether last month was profitable. The bank balance tells you where you stand today. Neither one tells you the thing that actually keeps you up at night — am I going to have enough cash three, six, nine weeks from now?
A 13-week forecast fills that gap. It’s a single table: 13 columns, one per week, and a handful of rows for the cash moving in and out. Every week has an opening balance, the cash you expect to collect, the cash you expect to pay, and a closing balance that becomes next week’s opening. Follow that closing line across the quarter and you can see, weeks in advance, exactly where the trouble is:
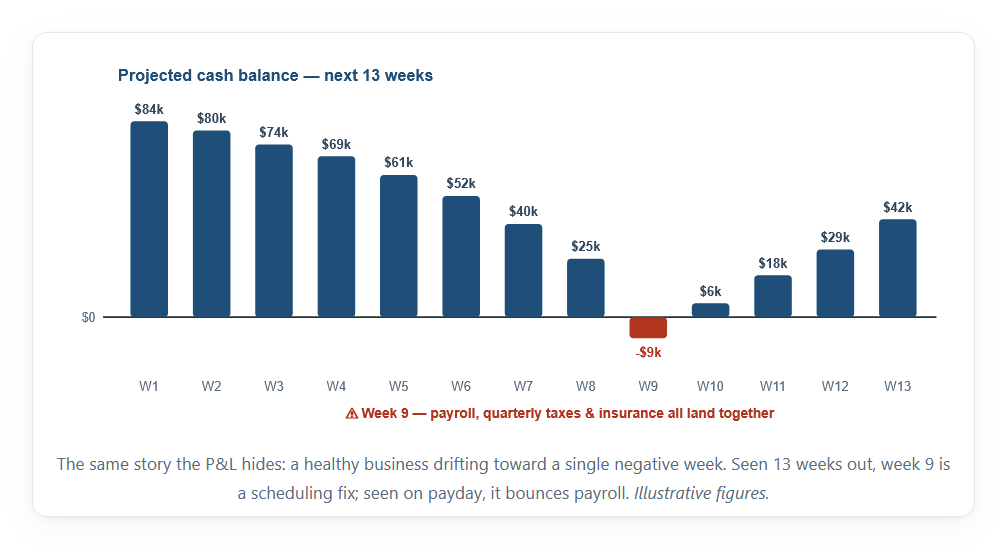
“Your monthly statements are a rear-view mirror. A 13-week forecast is the windshield.”
Why 13 Weeks?
Thirteen weeks is one quarter — and it’s the sweet spot for a reason. Shorter than that and you can’t see the lumpy, quarterly bills coming: taxes, insurance renewals, loan payments, seasonal swings. Much longer and the estimates get too soft to trust; nobody can predict week 40’s collections with a straight face. Thirteen weeks is long enough to catch the trouble that’s actually forming, and short enough that the numbers stay honest. It’s the standard tool restructuring and turnaround professionals reach for first, precisely because it works.
How to Build One, Step by Step
You can build a working version in a spreadsheet in an afternoon. Here’s the structure I use.
- Start with your real opening cash balance. Not the P&L, not what’s “coming” — the actual, reconciled balance across your accounts today. This is week 1’s opening number, and the whole forecast is only as trustworthy as this starting point. Clean, reconciled books are the price of admission.
- Lay out cash IN by week — collections, not sales. This is the mistake that breaks most forecasts, so say it out loud: you forecast money you’ll actually collect and deposit, in the week you’ll collect it — not the sales you booked. A sale on a 30-day account is not cash this week. Include everything real: card settlements, cash deposits, receivables you’ll actually collect, any owner contributions or loan draws.
- Lay out cash OUT by week — on the date it leaves. Payroll on payroll dates. Rent and fixed costs on their due dates. Vendor payments when you’ll actually pay them. And critically, the lumpy stuff most owners forget: quarterly taxes, insurance premiums, loan and equipment payments, owner draws, that annual software renewal. If it leaves the account, it goes in a row.
- Calculate each week’s net change and closing balance. For every week: opening balance + collections − payments = closing balance. That closing balance rolls into next week as the opening. This running line is the entire point — it’s what shows you the trouble.
- Make it rolling. A forecast built once and filed away is worthless. Each week, drop the week that just finished, add a new week 13 on the end, and update the numbers with what you now know. It stays a live, always-13-weeks-ahead view — not a snapshot that goes stale by Friday.
Here’s what a few weeks of the middle of a forecast look like — the exact stretch where our operator’s week nine went red:
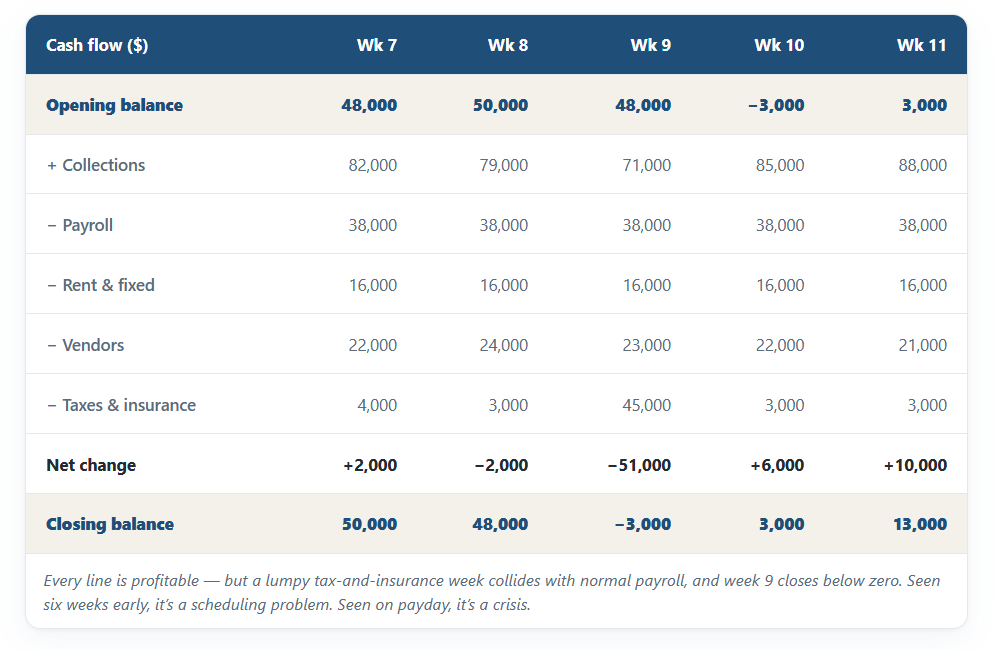
Notice what the forecast catches that the P&L never would: nothing here is unprofitable. The business is healthy. It’s the timing of one heavy week landing on top of ordinary payroll that creates the shortfall — exactly the kind of thing that’s invisible until the check bounces, unless you’re looking 13 weeks ahead.
WANT TO SKIP THE SPREADSHEET?
Building the forecast once is easy. Keeping it current every week, across every location, is the hard part. The KYN platform keeps your rolling 13-week forecast updated automatically from your reconciled numbers — so the tight week shows up on your screen while you can still move it, instead of you rebuilding a spreadsheet every Monday.
Reading the Forecast: The Signals That Matter
Once the table is built, four things tell you almost everything:
1
The lowest projected balance
Scan the closing line for its trough — the single lowest point and the week it hits. That number, not today’s balance, is the one that decides whether you sleep.
2
The week you breach your floor
Your danger line isn’t zero — it’s the minimum cash you need to operate safely. The first week the forecast dips below that floor is your action date.
3
One-off vs. recurring shortfalls
A single lumpy week (a tax bill) is a timing fix. The same gap repeating week after week is a structural problem in your working capital.
4
The trend of the closing line
Even with no red weeks, a closing balance drifting steadily down across the quarter is the earliest warning you’ll ever get. Act on the slope, not just the dip.
What This Looks Like in Real Life
An operator I worked with was about to buy a new oven. The bank balance looked healthy, the quarter had been strong, and on paper it was an easy yes. Before he signed, we pulled up his 13-week forecast — and there it was: payroll, a quarterly tax payment, and his insurance renewal all landing inside the same month, a few weeks out. Buying that week would have tipped him negative.
He didn’t cancel the purchase. He delayed it four weeks, until the forecast showed clear water. The oven still got bought; payroll never came close to the edge. One five-minute look at the weeks ahead turned a potential cash shortage into a non-event. That’s what the forecast buys you — not a different decision every time, just the same decision made with the timing in full view. (Illustrative, drawn from a pattern I’ve seen many times.)
The KYN 13-Week Rule™
A forecast only works if you actually look at it. So I turned it into a standing habit — the same four questions, every Monday morning, before the week gets away from you:
EVERY MONDAY, ASK FOUR QUESTIONS
- Will payroll clear — this week and next?
- Which vendors are due, and can the account carry them?
- Which of the next 13 weeks go negative?
- What one action will I take this week to protect the tightest week ahead?
Four questions, five minutes. Answer them every Monday and you’ll never again be blindsided by a week you could have seen coming. That habit — not the spreadsheet itself — is what keeps operators solvent.
The Mistakes That Wreck a Forecast
- Forecasting sales instead of collections. Sales are a P&L idea; a forecast lives on cash. Enter money in the week it actually hits the account, not the week you earned it.
- Using accrual numbers for timing. Your accounting system knows what you owe; it doesn’t always know the day you’ll pay it. The forecast runs on real dates — when cash truly moves.
- Forgetting the lumpy outflows. Quarterly taxes, insurance renewals, equipment loans, owner draws — the irregular payments are precisely the ones that blow up a week, and precisely the ones people leave out.
- Building it once and walking away. A 13-week forecast is a rolling habit, not a one-time file. Update it weekly or it quietly becomes fiction.
- Being optimistic about collections. Forecast what you’ll realistically collect, on realistic dates. A forecast that assumes everyone pays early is just a wish with columns.
What I Finally Did About It
Here’s the honest problem with everything I just described: it works, and almost nobody keeps it up. Building the first 13-week forecast takes an afternoon. Rebuilding it every week, across multiple locations, pulling fresh numbers, re-checking every collection and payment date — that’s where good intentions go to die. And a forecast you don’t update is worse than none, because it lies to you with confidence.
After watching too many capable operators start a forecast and abandon it by week three, I built the system I wished I’d had. That’s the KYN Financial Platform. It starts from one hard rule: your books have to be clean and reconciled first, because a forecast built on messy numbers is just a faster way to be wrong. From there it maintains the rolling 13-week cash flow forecast for you — across every location, refreshed automatically, so the trough is always up to date and the red week shows up while you can still move it.
I didn’t hand it to anyone else until I trusted it in my own business. I’ve run on it for the last five years — cash and profit, every week, thirteen weeks ahead — before I ever offered it to another operator. Where the money went, what this week’s profit is, and what the next 13 weeks of cash are about to do: that’s the whole job, and it’s the job this was built to do.
The KYN Decision Framework
Every article in this series comes back to the same five-step loop — the one I run my own business on:
THE KYN DECISION FRAMEWORK
- Know Your Books — start from clean, reconciled numbers. Nothing downstream works without this.
- Know Your Numbers — see cash and profit together, across every location.
- See the Trend — look weeks ahead, not just back at last month.
- Make the Decision — act while you still have room to change the outcome.
- Review Every Week — make it a standing habit, not a fire drill.
Key Takeaways
THE 5 THINGS TO REMEMBER
- A 13-week forecast is a rolling, week-by-week projection of cash in and cash out over the next quarter — starting from today’s real balance.
- Thirteen weeks is the sweet spot: long enough to catch quarterly bills, short enough to stay accurate.
- Forecast collections and payments by the week cash actually moves — not sales, not accruals.
- Read four signals: the lowest projected balance, the week you breach your floor, one-off vs. recurring gaps, and the trend of the closing line.
- Its power is in the update — a forecast refreshed weekly warns you early; one filed away is fiction.
Common Questions
1 What is a 13-week cash flow forecast?
2 Why 13 weeks and not 12 or 52?
3 How often should I update a 13-week cash flow forecast?
4 What’s the difference between a cash flow forecast and a budget or P&L projection?
5 Who should use a 13-week cash flow forecast?
A profitable quarter can still hide a week you can’t cover. The forecast finds that week while you can still fix it. Right Numbers. Right Time. Right Decisions.
Want your rolling 13-week forecast built and kept current automatically, across every location? Book a KYN demo and I’ll walk you through it personally — we’ll look 13 weeks ahead together and find your tight week before it finds you.
GET THE TOOL
Want a head start? Download the free 13-Week Cash Flow Forecast Template — a ready-to-use spreadsheet with the rows, formulas, and running-balance line from this article, so you can plot your next quarter this week.
IF YOU REMEMBER ONE THING
A profitable quarter can still hide a week you can’t cover. Look 13 weeks ahead, every Monday, and you’ll find that week while you can still fix it.
Numbers don’t make decisions. Owners do. The right numbers simply help you make the right one.
Mohan Patel
Founder, KYN USA
Mohan Patel has spent more than 30 years in the trenches of multi-location operations. He founded KYN after watching too many profitable operators get blindsided by cash, and he still runs his own business on the platform every week — because better decisions start with better visibility.
KYN is the Financial Performance Platform for multi-location operators.
- 30+ years in restaurant operations
- Managed 170+ restaurant locations
- Helped 500+ business owners
- Founder of the KYN Financial Performance Platform
30+
years operating
500+
owners advised
170+
locations run
6
states