

The Weekly Numbers Habit: Building an Operator’s Dashboard
KYN Insights
Operator Playbooks · Mohan Patel
Cash Clarity for Multi-Location Operators
6
Series · Cash Clarity for Multi-Location Operators
Part 4 of 6
The Weekly Numbers Habit: Building an Operator’s Dashboard
The most profitable habit in the business isn’t a metric — it’s a rhythm. Here’s the handful of numbers to watch every week, and the simple cycle that turns them into decisions.

Mohan Patel
Founder, KYN
On this page
For years I ran my business the way almost everyone does: I waited for the month to close. The books would get finished a week or two into the next month, my accountant would send the P&L, and I’d sit down to find out how we did. By then, whatever had gone wrong was three, four, sometimes six weeks in the past — long past the point where I could do anything about it.
The month I found $122 in the bank after a “profitable” month was the month that habit finally broke. I realized I’d been driving by looking in the rear-view mirror, and calling it management.
So I changed one thing. Every Monday morning, before anything else, I sat down with the same short list of numbers. Not the full month-end package — just a handful of figures that told me where cash and performance actually stood, that week. It took fifteen minutes.
That fifteen-minute habit did more for my business than any report I’d ever waited a month for. Problems showed up while they were still small. Good weeks got reinforced. Decisions got made on Tuesday instead of the following month. Nothing about the business was different — only how often I looked, and how quickly I could act.
This article is about that habit: the numbers worth watching every week, and the simple cycle that turns looking into deciding.
The Short Answer
THE SHORT ANSWER
Profit doesn’t pay your bills — cash does. Growing operators run out of money because expansion ties up cash in inventory, payroll, and buildout before the new revenue lands. The cash gap, not the P&L, is what sinks profitable restaurants. Track cash and profit together.
Month-end tells you what happened. A weekly habit lets you change what happens next. Here’s how to build one.
Why Weekly Beats Monthly
Monthly financials are necessary, but as a management tool they arrive too late. By the time the books close and the P&L lands, you’re often looking at a picture that’s five or six weeks old. A bad week in the first week of the month can hide inside an average month and never get addressed until it’s repeated three more times.
Weekly changes the math entirely. A number trending the wrong way for two weeks running is a signal you can act on — reorder less, adjust a schedule, chase a collection, hold a payment. The same number seen once a month is just history. As I said earlier in this series: a number you see once a month is a eulogy; a number you see weekly is a warning you can still do something about
“You can’t manage a business at the speed of month-end. The decisions happen weekly, so the numbers have to as well.”
The Numbers on an Operator’s Dashboard
A dashboard isn’t “every number you have.” The whole point is a short list you’ll actually look at every week. Here are the six that earn their place for most multi-location operators:
1
Cash on hand & runway
The balance, and how many weeks of obligations it covers. Trend matters more than the single number.
2
Sales vs. forecast
Actual sales against what you expected, by location. Misses and beats both tell you something — early.
3
Prime cost
Food plus labor as a percentage of sales — the number that quietly decides whether a restaurant makes money.
4
Labor % of sales
Watched weekly, it’s a lever you can still pull through scheduling before the period closes.
5
The 13-week cash outlook
Your forecast’s tightest week ahead — so a coming crunch is a scheduling fix, not a payday surprise.
6
Profit & cash, side by side
Read together every week, “where did the money go?” stops being a mystery.
Notice what’s not here: a wall of vanity metrics. If a number won’t change a decision this week, it doesn’t belong on the weekly dashboard. Depth is for month-end; the weekly view is for action.
The KYN Weekly Decision Cycle™
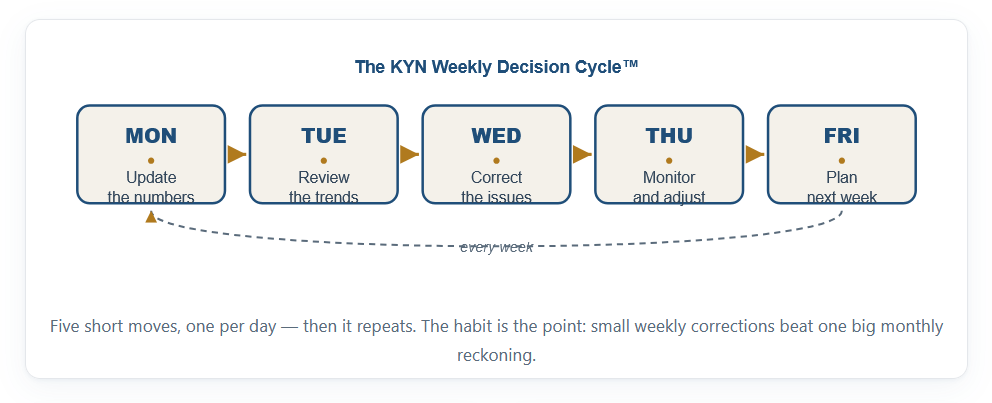
Having the numbers isn’t the habit — using them is. Over the years I boiled the weekly rhythm down to five short moves, one per day. None of them takes long. Together they turn a dashboard into decisions:
M
Monday — Update the numbers
Start the week with a clean, current dashboard. You can’t decide on data you don’t trust.
T
Tuesday — Review the trends
Look at direction, not just today’s value. Which numbers are drifting, and where?
W
Wednesday — Correct the issues
Act on what you saw: adjust a schedule, tighten an order, chase a collection, hold a payment.
T
Thursday — Monitor & adjust
Did the correction take? Confirm the number moved, and fine-tune before the weekend.
F
Friday — Plan next week
Set the coming week with eyes open — staffing, orders, and the tight spots you already see ahead.
Five moves, a few minutes each, and then it repeats. The magic isn’t any single day — it’s that the loop never stops. Small weekly corrections compound into a business that rarely gets blindsided.
What This Looks Like in Real Life
An operator I worked with was a classic month-end manager — sharp, experienced, but always reacting a month late. His prime cost would creep up in week one, and he wouldn’t know until the P&L landed six weeks later, by which point he’d repeated the same over-ordering four times.
We didn’t add staff or software he didn’t need. We set a standing 20-minute Monday review of six numbers and gave the week a simple rhythm. Within a couple of months, his prime cost stopped drifting — not because he worked harder, but because he was catching the creep in week one instead of week six. Same operator, same locations. He just started looking while he could still do something about it. (Illustrative, drawn from a pattern I’ve seen many times.)
What This Looks Like in Real Life
- Only looking at month-end. The single biggest one. If your first look at a bad trend is the closed P&L, you’ve already lived it three or four times.
- Too many metrics. A dashboard with forty numbers gets ignored. Pick the handful that change decisions and cut the rest.
- Looking but not acting. A dashboard you review and don’t respond to is just anxiety with charts. The cycle only works if Wednesday actually corrects something.
- Inconsistent cadence. Every-other-week-when-I-remember isn’t a habit. Same day, same numbers, every week — the rhythm is the whole point.
What I Finally Did About It
The hard part of the weekly habit isn’t the discipline — it’s the setup. Pulling six current numbers together every Monday, across every location, from POS and payroll and the bank, is exactly the kind of manual chore that quietly kills the habit by week three. If updating the dashboard takes two hours, you won’t do it for long.
So I built the dashboard I wanted to open every Monday. That’s the KYN Financial Platform. On the hard rule that your books are clean and reconciled first, it pulls your weekly numbers into one live view across every location — cash, sales versus forecast, prime cost, labor, and the 13-week outlook — updated for you, so the habit takes minutes instead of hours. The Monday review stops being a chore and becomes a decision.
I ran my own business on that Monday rhythm for five years before I offered it to anyone else. It’s the single habit I’d least want to give up.
The KYN Decision Framework
Every article in this series comes back to the same five-step loop — the one I run my own business on:
THE KYN DECISION FRAMEWORK
- Know Your Books — start from clean, reconciled numbers. Nothing downstream works without this.
- Know Your Numbers — see cash and profit together, across every location.
- See the Trend — look weeks ahead, not just back at last month.
- Make the Decision — act while you still have room to change the outcome.
- Review Every Week — make it a standing habit, not a fire drill.
Key Takeaways
THE 5 THINGS TO REMEMBER
- The weekly numbers habit beats month-end because it lets you act while problems are still small.
- Build a short dashboard: cash & runway, sales vs. forecast, prime cost, labor %, the 13-week outlook, and profit-and-cash together.
- If a number won’t change a decision this week, keep it off the weekly view.
- Run the KYN Weekly Decision Cycle: update, review, correct, monitor, plan — one move a day.
- The rhythm is the point. Same day, same numbers, every week — that consistency is the edge.
Common Questions
1 What is a weekly numbers habit?
2 What numbers should a restaurant owner track weekly?
3 Why review numbers weekly instead of monthly?
4 What is an operator’s dashboard?
5 How many metrics should be on a dashboard?
The most valuable habit in your business takes fifteen minutes a week. Same day, same numbers, every week. Right Numbers. Right Time. Right Decisions.
Want your weekly dashboard built and updated for you, across every location? Book a KYN demo and I’ll walk you through it personally — we’ll set up the Monday review you’ll actually keep.
GET THE TOOL
Want to start this Monday? Download the free Operator’s Weekly Dashboard Template — a one-page layout with the six numbers from this article, ready to fill in and review each week.
IF YOU REMEMBER ONE THING
Don’t wait for the month to close to find out how you’re doing. Look at a few numbers every week — while you can still change the outcome.
Numbers don’t make decisions. Owners do. The right numbers simply help you make the right one.
Mohan Patel
Founder, KYN USA
Mohan Patel has spent more than 30 years in the trenches of multi-location operations. He founded KYN after watching too many profitable operators get blindsided by cash, and he still runs his own business on the platform every week — because better decisions start with better visibility.
KYN is the Financial Performance Platform for multi-location operators.
- 30+ years in restaurant operations
- Managed 170+ restaurant locations
- Helped 500+ business owners
- Founder of the KYN Financial Performance Platform
30+
years operating
500+
owners advised
170+
locations run
6
states